BIS Annual Economic Report 2023
Introduction
El Informe Económico Anual de este año explora la trayectoria de la economía mundial y los retos políticos que plantea. Se trata, de hecho, de una exploración no de uno, sino de tres viajes entrelazados: el viaje que ha llevado a la economía mundial hasta la coyuntura actual; el viaje que puede quedar por delante; y, en segundo plano, el viaje que podría hacer el sistema financiero a medida que la digitalización abra nuevas perspectivas. Es mucho lo que está en juego. Los responsables políticos tendrán que trabajar de forma concertada, extrayendo las lecciones adecuadas del pasado para trazar un nuevo camino para el futuro. Por el camino, la perenne pero esquiva búsqueda de coherencia entre la política fiscal y la monetaria volverá a ocupar un lugar central. La política prudencial seguirá desempeñando un papel de apoyo esencial. Y las políticas estructurales serán fundamentales.
A continuación se analiza cada una de estas tres trayectorias.
The macroeconomic journey: looking back
¿Cómo le fue a la economía mundial en el año examinado? Y lo que es aún más importante, ¿qué fuerzas determinaron su trayectoria?
The year under review
La inflación siguió situándose muy por encima de los objetivos de los bancos centrales en gran parte del mundo. Afortunadamente, había indicios claros de que la inflación general estaba tocando techo o había empezado a descender. Pero la inflación subyacente se mostró más obstinada. El retroceso de los precios de las materias primas y la marcada desaceleración de los precios manufactureros proporcionaron un alivio bienvenido, incluso cuando los precios de los servicios, más rígidos, cobraron impulso. Estaban actuando varias fuerzas, entre ellas el alivio de los cuellos de botella en la cadena de suministro mundial, la rotación post-pandémica de la demanda mundial desde el sector manufacturero a los servicios, y los efectos de los generosos paquetes de apoyo fiscal. Los mercados laborales se mantuvieron muy tensos, con tasas de desempleo en general en mínimos históricos.
El crecimiento mundial se ralentizó, pero demostró una notable resistencia. La tan temida recesión en Europa no se materializó, gracias en parte a un invierno suave, y China repuntó con fuerza una vez que se levantaron repentinamente las restricciones de Covid. El consumo se mantuvo sorprendentemente bien en todo el mundo, ya que los hogares siguieron recurriendo a los ahorros acumulados durante la pandemia y el empleo se mantuvo boyante. A medida que avanzaba el año, los expertos revisaron al alza sus previsiones de crecimiento, aunque seguían viendo un crecimiento mundial más lento en el año siguiente.
Una vez más, las tensiones provocaron una intervención oficial a gran escala a ambos lados del Atlántico para evitar el contagio, una imagen preocupante y cada vez más familiar. Los bancos centrales activaron o ampliaron las facilidades de liquidez o las compras de activos. Cuando fue necesario, los gobiernos proporcionaron respaldo de solvencia, implícita o explícitamente, en forma de garantías y apoyo final a los sistemas ampliados de seguro de depósitos. La respuesta restableció la calma en los mercados.
En respuesta al endurecimiento y a las perspectivas económicas, las condiciones financieras reaccionaron de forma desigual. En general, los bancos endurecieron las condiciones crediticias. Pero los mercados financieros reaccionaron menos. En general, las condiciones se endurecieron en comparación con las existentes en el momento de la primera subida. Sin embargo, en la segunda mitad del año se relajaron un poco, a medida que bajaban los rendimientos de los bonos y subían los precios de los activos de riesgo. Los bancos centrales se enfrentaron a una desconexión entre su comunicación, que apuntaba a un endurecimiento más persistente, y las opiniones de los participantes en los mercados financieros, que veían una postura más relajada en el futuro.
The longer-term backdrop
Como se analiza en detalle en el Capítulo II, la combinación de inflación elevada y vulnerabilidades financieras probablemente refleje mejor la confluencia de dos factores interdependientes. En primer lugar, la forma cambiante del ciclo económico. En segundo lugar, las políticas monetaria y fiscal ponen a prueba, una vez más, los límites de lo que podría denominarse la "región de estabilidad", es decir, la región que traza las constelaciones de las dos políticas que fomentan una estabilidad macroeconómica y financiera sostenible, manteniendo controlables las inevitables tensiones entre las políticas. La forma cambiante del ciclo económico determina qué tipo de síntoma señala que se están poniendo a prueba los límites: la inflación, la inestabilidad financiera o ambas. La conducta de la política, en interacción con las fuerzas estructurales, determina la forma del propio ciclo económico.
De ahí un agudo dilema político. Una dolorosa lección que los responsables políticos habían extraído de la época de alta inflación era que las políticas que resultaban demasiado ambiciosas podían generar inestabilidad de precios. En la era de baja inflación, sin embargo, las limitaciones a las expansiones económicas habían desaparecido aparentemente. Los límites de la región de estabilidad se habían vuelto más difusos, apenas visibles de hecho. Y la fragilidad del sistema financiero, no respaldada por un esfuerzo suficientemente incisivo para reforzar la regulación prudencial, enturbiaba aún más el panorama. La economía parecía estable hasta que, de repente, dejó de serlo. La experiencia posterior a la Gran Crisis Financiera (CFG) difuminó aún más los límites de la región. La inflación rondaba obstinadamente por debajo de los objetivos de inflación: tras haber ayudado a los esfuerzos de los bancos centrales, la globalización los obstaculizaba ahora. Y se pidió a la política fiscal que se pusiera manos a la obra para garantizar que los bancos centrales dejaran de ser el "único juego en la ciudad", y así fue.
El notable repunte de la demanda mundial tras la pandemia, con las interrupciones de la oferta como telón de fondo, hizo el resto. Contra todo pronóstico, la inflación volvió con fuerza. La política monetaria tuvo que endurecerse, tensando las finanzas públicas y los balances del sector privado. El sistema financiero se vio sometido a tensiones. Aunque era comprensible cuando estalló la crisis de Covid, en retrospectiva, ahora está claro que el apoyo de la política fiscal y monetaria fue demasiado grande, demasiado amplio y demasiado duradero..
The macroeconomic journey: looking ahead
Teniendo en cuenta dónde nos encontramos, ¿cómo se presenta el camino por recorrer? A corto plazo, es posible que la economía mundial supere sin problemas los obstáculos a los que se enfrenta. Esto es lo que parecen anticipar los participantes en los mercados financieros y los analistas profesionales. Además, mirando más hacia el futuro, el viaje podría continuar sin mayores incidentes. Dicho esto, los peligros a corto y largo plazo acechan en el camino. Y las políticas serán el factor decisivo.
Near- and longer-term hazards
A corto plazo, destacan dos retos: restablecer la estabilidad de precios y gestionar los riesgos financieros que puedan materializarse.
La inflación podría resultar más persistente de lo previsto. Es cierto que ha ido disminuyendo, y la mayoría de los analistas prevén que se sitúe dentro de los intervalos objetivo en los próximos dos años. Además, las expectativas de inflación, aunque difíciles de medir con fiabilidad, no han hecho saltar las alarmas. Aun así, la última milla podría resultar más difícil de recorrer. El sorprendente repunte de la inflación ha erosionado sustancialmente el poder adquisitivo de los salarios. No sería razonable esperar que los asalariados no intentaran ponerse al día, sobre todo teniendo en cuenta que los mercados laborales siguen siendo muy estrechos. En varios países, las demandas salariales han ido en aumento, las cláusulas de indexación han ido ganando terreno y han aparecido signos de una negociación más enérgica, incluidas huelgas. Si los salarios se recuperan, la cuestión clave será si las empresas absorben los costes más elevados o los repercuten. Dado que las empresas han recuperado su poder de fijación de precios, no hay que subestimar esta segunda posibilidad. Nuestras simulaciones ilustrativas indican que, en este escenario, la inflación podría seguir siendo incómodamente alta. Como documentaba el Informe Económico Anual del año pasado, las transiciones de regímenes de baja inflación a regímenes de alta inflación tienden a autorreforzarse. Y una vez que se instala la psicología de la inflación, es difícil desprenderse de ella.
Unos tipos de interés más altos, un giro en el ciclo financiero y una desaceleración económica acabarían por elevar las pérdidas crediticias. Éstas, a su vez, podrían generar nuevas tensiones en el sistema financiero. Es bastante habitual que las tensiones bancarias aparezcan tras un endurecimiento de la política monetaria, hasta en una quinta parte de los casos en los tres años siguientes a la primera subida. La incidencia aumenta considerablemente cuando los niveles iniciales de deuda son altos, los precios inmobiliarios son elevados o el aumento de la inflación es más fuerte
Una vez que se materialice el tramo crediticio, la resistencia del sistema financiero volverá a ponerse a prueba. Simulaciones sencillas indican que, en el escenario de tipos de interés implícitos de mercado, en una muestra representativa de economías avanzadas las pérdidas de crédito estarían en línea con las medias históricas. Pero serían de una magnitud similar a las registradas durante la CFG en el escenario de tipos más altos por más tiempo.
The impact of those losses will depend, critically, on the loss-absorbing capacity of the banking system. Since the GFC, thanks in no small measure to the financial reforms, banks have bolstered their capital. That said, pockets of vulnerability remain. Recent events have shown how the failure of even comparatively small institutions can shake confidence in the overall system. Moreover, the price-to-book ratios of many banks, including large ones, have been languishing far below one. This reflects market scepticism about the underlying valuations and long-term profitability of those institutions. Admittedly, this is not new. But, in an environment of more fragile confidence, it could turn out to be a significant vulnerability.
Before stress emerged among banks, all the attention was focused on the NBFI sector. And with reason. The sector has grown in leaps and bounds since the GFC, and now accounts for over half of all financial assets globally. While, on balance, less leveraged than its banking counterpart, the sector is rife with hidden leverage and liquidity mismatches, especially in the asset management industry. It has been a source of large losses for banks, such as in the Archegos case – which, incidentally, hit Credit Suisse especially hard. And it was at the heart of the March 2020 turmoil, which prompted large-scale central bank interventions. The latest tremors in the UK gilt market are a reminder that attention is still justified.
While it is hard to tell where strains might emerge next, several vulnerabilities stand out. In the corporate sector, private credit markets remain very opaque against the backdrop of a long-term deterioration in credit ratings. In the leveraged loan market, securitised products have grown rapidly. Exposures to commercial real estate are bound to see losses, as the sector is buffeted by powerful cyclical and structural headwinds – losses that could also be a source of stress for banks, as they have been throughout history. In addition, structural weaknesses linger in some government bond markets.
Looking further out, a key source of concern is the sustainability of public debt – an issue analysed in depth in Chapter II. A vulnerable sovereign means a vulnerable financial system. This is because the sovereign can generate financial instability or fail to act as an effective backstop of the financial sector. Central banks can provide liquidity, but only the sovereign can back up solvency. Moreover, the sovereign's creditworthiness depends on the health of the financial sector. Indeed, banking crises have typically caused surges in public debt, in teens of GDP – directly, because of the government support, and indirectly, because of the damage to economic activity. Long-term projections of public debt trajectories are worrisome, even under favourable interest rate and growth configurations (see below).
Near- and longer-term policy challenges
The sheer size of the challenges ahead calls for a holistic policy response, involving monetary, fiscal, prudential and, last but not least, structural policies. Consider, in turn, the near-term and longer-term challenges, although the dividing line between the two is quite fuzzy.
The near term
La prioridad de la política monetaria es volver a situar la inflación en su objetivo. Es bien conocido el insidioso daño que un régimen de alta inflación causa al tejido económico y social. Cuanto más tiempo se permita que persista la inflación, mayor será la probabilidad de que se consolide y mayores los costes de apagarla.
Para volver a situar la inflación en el objetivo, los bancos centrales se enfrentan al menos a tres retos. En primer lugar, las relaciones estadísticas históricas ofrecen una orientación limitada cuando amenaza una transición a un régimen de alta inflación. Tanto el juicio como los modelos más formales se ponen a dura prueba. En segundo lugar, el mecanismo de transmisión de la política monetaria se ve enturbiado por las excepcionales condiciones pospandémicas, que se suman a los conocidos desfases. De ahí la pausa que muchos bancos centrales se han tomado para evaluar mejor el impacto del endurecimiento hasta ahora. Por último, podrían surgir nuevas tensiones en el sistema financiero. En ese caso, si la tensión es lo suficientemente aguda, abordarla sin comprometer la lucha contra la inflación requerirá el apoyo activo de otras políticas, sobre todo prudenciales y fiscales, para complementar el despliegue por parte de los bancos centrales de la gama de herramientas a su disposición. Esto contendría el daño al tiempo que permitiría a la política monetaria mantener una postura restrictiva durante el tiempo que fuera necesario.
The priority for fiscal policy is to consolidate. To be sure, deficits have narrowed somewhat, especially in cyclically adjusted terms. But some of the improvement reflects the temporary impact of the inflation burst, and cyclical adjustments have proved quite misleading in the past, especially before slowdowns. Moreover, from a long-term perspective, deficits remain too high. Consolidation would provide critical support in the inflation fight. It would also reduce the need for monetary policy to keep interest rates higher for longer, thereby reducing the risk of financial instability.
By bolstering the financial system's resilience, prudential policy can also support the inflation fight, as it would increase monetary policy headroom. Macroprudential measures need to be kept tight for as long as possible, or even tightened further where appropriate. Similarly, (microprudential) supervision needs to be stiffened to remedy some of the deficiencies that came to light in recent bank failures. While changes in regulatory standards take longer, a reflection on the recent experience should start without delay; and indeed it has. Examples of issues to be examined are the treatment of interest rate risk, the appropriateness of historical cost accounting, not least for assets used for liquidity management purposes (eg government securities) and assumptions about the stickiness of various deposit categories. But beyond banking, we should not lose sight of the urgent need to strengthen the regulation of NBFIs from a systemic perspective.
The longer term
For monetary policy, two aspects stand out. As regards operational frameworks, it is essential to combine price stability objectives with the appropriate degree of flexibility. As explored in depth in last year's Annual Economic Report, low-inflation regimes, in contrast to high-inflation ones, have self-stabilising properties. No doubt this reflects, in part, the fact that, when inflation is mild, it ceases to be a significant factor influencing people's behaviour. This suggests that, under those conditions, there is room for greater tolerance for moderate, even if persistent, shortfalls of inflation from narrowly defined targets. The approach would also reduce the side effects of keeping interest rates very low for extended periods, such as the build-up of financial vulnerabilities and possible misallocation of resources. As regards institutional frameworks, to buttress the credibility of policy, safeguards for central bank independence, underpinned by appropriate mandates, remain essential. They should become especially valuable in the future, should fiscal positions continue to follow their deteriorating trend.
For fiscal policy, the priority is to ensure fiscal sustainability. Fiscal sustainability is the cornerstone of economic stability and is critical for monetary policy to do its job. Unfortunately, the long-term outlook is grim. Even under favourable assumptions, without sustained and firm consolidation efforts, debt-to-GDP ratios are set to rise relentlessly, threatening safety margins. The looming additional burdens linked to ageing populations, the green transition and geopolitical tensions complicate the picture further. And so does the apparent change in public attitudes following the generous support granted in the wake of the GFC and Covid crises, which has raised expectations regarding government transfers. From an operational perspective, the prominence of financial factors in economic fluctuations merits greater attention when assessing cyclical fiscal positions and fiscal space more generally. From an institutional perspective, there is a need to give more bite to properly designed fiscal rules and fiscal councils, including possibly through constitutional safeguards.
For prudential policy, there is a need for continuous adjustments. The dialectic between financial markets and regulation makes it impossible to stand still. The recent episodes of stress have provided just the latest example. As regards the financial stability risks raised more specifically by fiscal policy, an area that merits particular attention is the favourable treatment of sovereign debt. Adjustments to account effectively for market and credit risk in government securities would also need to give due consideration to the special role that government debt plays in the functioning of the financial system and in central bank operations. Institutionally, just as for monetary policy, it is important to secure the independence of supervisory authorities and to endow them with sufficient resources, both financial and human.
In addition, there is a need to further reflect on crisis management and the financial system's safety net more generally. Policy actions have, de facto, been extending the safety net with each crisis. And now there are proposals to reduce the scope for runs by extending deposit guarantee schemes further. Once confidence is lost, however, deterring runs and preventing institutions from losing market access would require nothing short of insuring 100% of demandable and short-term claims. This would weaken market discipline far too much and, ultimately, increase solvency risks to unacceptable levels. Moreover, while resolution schemes have been improved and should be improved further, when confidence crumbles, the pressure to extend support becomes insurmountable.
This suggests that expectations should be realistic and that a premium should be put on crisis prevention. It indicates that, refinements aside, there is no substitute for a holistic macroeconomic policy framework that promotes financial and macroeconomic stability, bolstered by a regulatory and supervisory apparatus that boosts the financial system's loss-absorption capacity. As described in previous Annual Economic Reports, such a comprehensive macro-financial stability framework, in which all policies play their part, is the way to go. Crises cannot be avoided altogether, but their likelihood and destructive force can be contained.
Accordingly, the ambition needed to build such a framework should be combined with realism about what it can deliver and humility in the way it is run. The challenges the global economy is now facing reflect, in no small measure, a certain "growth illusion", born out of an unrealistic view of what macroeconomic stabilisation policies can achieve. We should avoid falling into the same trap again. Its unintended result has been reliance on a de facto debt-fuelled growth model that has made the economic system more fragile and unable to generate robust and sustainable growth. Overcoming this reliance requires growth-oriented structural reforms (Chapters I and II). Unfortunately, such reforms have been flagging for too long. They should be revived with urgency.
Digitalisation and the financial system: the journey ahead
This takes us to the third and final journey. An important aspect of growth-oriented structural reform is digital innovation in the monetary and financial system. Historically, key innovations in monetary arrangements have enabled new types of economic activity that have led to major advances in the economy. For example, money as ledger entries overseen by trusted intermediaries paved the way for new financial instruments such as bills of exchange that boosted trade by bridging the geographical distance and the timing gap between incurring costs and receiving payment. The gains became even bigger once electronic record-keeping replaced paper ledgers.
Central banks have a duty to lead advances in the monetary system in their role as guardians. The central bank issues the economy's unit of account and ensures the finality of payments through settlement on its balance sheet. Building on the trust in central bank money, the private sector uses its creativity and ingenuity to serve customers. When viewed through this lens, the fight against inflation is just another aspect of the central bank's broader duty to defend the value of money. In the same vein, the central bank's role in innovation serves to defend the value of money by providing it in a form that keeps pace with technology and the needs of society.
Chapter III charts the course for the future of the monetary and financial system. It argues that the system could be on the cusp of a major technological leap. Following the dematerialisation of money from coins to book entries and the digital representation of those ledger entries, the next key development could be tokenisation – the digital representation of money and assets on a programmable platform. Unlike conventional ledgers, which rely on account managers to update records, tokens can incorporate the rules and logic governing transfers. Money and asset claims become executable objects that the user can transfer directly. Tokenisation could enhance the capabilities of the monetary and financial system, not just by improving current processes but also by enabling entirely new economic arrangements that are impossible in today's system. In short, tokenisation could improve the old, and enable the new.
Tokenisation overcomes a key limitation of today's arrangements. Currently, the digital representation of money and other claims resides in siloed proprietary databases, located at the edges of communication networks. These databases must be connected through third-party messaging systems that exchange messages back and forth. As a result, transactions need to be reconciled separately before eventually being settled with finality. Meanwhile, participants have an incomplete picture of actions and circumstances. This incomplete information, and the associated misaligned incentives, preclude some transactions that have a clear economic rationale. While workarounds, such as collateral or escrow, exist, they do have limitations and create their own inefficiencies. Tokenisation addresses the problems more fundamentally. Resolving FX settlement risk and unlocking supply chain finance are two examples discussed in the chapter. Both are thorny problems in the conventional financial system that are amenable to solution in a tokenised environment.
New demands are also emerging from end users themselves, as advances in digital services in everyday life raise their expectations. Users now demand that the monetary and financial system operate just as seamlessly as the apps on their smartphones. These demands are beginning to outgrow the siloed domains that are holding innovation back.
Chapter III presents a blueprint for a future monetary system. The blueprint envisages a new type of financial market infrastructure (FMI) – a "unified ledger". The key elements of the blueprint are central bank digital currencies (CBDCs), private tokenised money in the form of tokenised deposits and tokenised versions of other financial or real assets, depending on the particular use case. The success of this endeavour rests on the foundation of trust provided by central bank money and its capacity to knit together key elements of the financial system. To be sure, in crypto, stablecoins that reside on the same platform as other crypto assets also perform a means of payment role. However, for reasons explored at length in last year's Annual Economic Report, crypto is a flawed system, with only a tenuous connection to the real world. Central bank money is a much firmer foundation. The full potential of tokenisation is best harnessed by having central bank money reside in the same venue as other tokenised claims.
As a new type of FMI, a unified ledger will come with attendant setup costs. While some of the envisaged benefits could also be reaped through more incremental changes to existing systems, history shows that such fixes have their limits, especially as they accumulate on top of legacy systems. Each new layer is constrained by the need to ensure compatibility with the legacy components. These constraints become more binding as more layers are added, holding back innovative developments.
In the near term, a unified ledger could unlock arrangements that have clear economic rationale but which have not been feasible to date due to the limitations of the current system. Over the longer term, the eventual transformation of the financial system will be far more significant. The benefits will be limited only by the imagination and ingenuity of developers, much as the ecosystem of smartphone apps has defied the initial imagination of the platform-builders themselves.
Conclusion
El
camino que tienen por delante la economía mundial y su sistema
financiero es peligroso. Sin embargo, también ofrece grandes
oportunidades. Encauzar el rumbo en la dirección correcta no será nada
fácil. Requiere una rara mezcla de criterio, ambición, realismo y la
voluntad y capacidad políticas para aplicar las políticas necesarias.
Estas políticas suelen implicar costes a corto plazo como precio a pagar
por mayores beneficios a largo plazo. Afortunadamente, el camino no
está predeterminado.
Monetary and fiscal policy: safeguarding stability and trust
Política monetaria y fiscal: salvaguardar la estabilidad y la confianza
Para propiciar un entorno financiero y macroeconómico estable y mantener manejables las tensiones entre ellas, las políticas deben operar dentro de una "región de estabilidad". El riesgo último de salirse de la región es la pérdida de la confianza que la sociedad debe tener en el Estado y en su toma de decisiones.
En las últimas décadas, las políticas monetaria y fiscal se han desplazado gradualmente hacia los límites de la región de estabilidad, ya que a menudo se confiaba en ellas como motores de facto del crecimiento. Esto ha sentado las bases para las actuales tensiones entre ellas, así como para los riesgos macroeconómicos y financieros que se avecinan.
Se necesitan ajustes políticos y salvaguardias institucionales para garantizar que ambas políticas se mantengan firmemente dentro de la región de estabilidad. Estos ajustes dependen de un mayor reconocimiento de las limitaciones de las políticas de estabilización macroeconómica.
Introduction
Por
primera vez en las últimas décadas, estamos asistiendo a la aparición
conjunta de una inflación elevada y de tensiones financieras. Aunque
cada una tiene sus causas específicas (Capítulo I), son, en gran medida,
un síntoma del efecto acumulativo de la política monetaria y fiscal
acomodaticia de las últimas décadas, que culminó con las medidas
extraordinarias de apoyo lanzadas en respuesta a la pandemia. En muchos
países, los tipos de interés oficiales, nominales y reales, fueron
históricamente bajos durante un periodo prolongado y los balances de los
bancos centrales se dispararon hasta niveles nunca vistos en tiempos de
paz (Gráfico 1.A). Al mismo tiempo, los persistentes y abultados
déficits fiscales provocaron un aumento progresivo de la deuda pública
hasta niveles sin precedentes (Gráfico 1.B). Estas trayectorias
políticas dieron un impulso importante y duradero a la inflación y
fomentaron la acumulación de fragilidades en el sistema financiero.
El reciente desafío a las fronteras es el último de un largo camino que se remonta al menos a los años setenta. En cada momento, las opciones políticas parecían razonables, incluso convincentes. Pero acumulativamente, empujaron las políticas hacia los límites. La causa fundamental de esta deriva ha sido la tendencia de los responsables políticos a sucumbir a una especie de "ilusión de crecimiento", es decir, una visión demasiado optimista sobre la capacidad de las políticas de estabilización macroeconómica para mantener el crecimiento económico.

Policy adjustments and institutional safeguards are needed to ensure that monetary and fiscal policy remain firmly within the region of stability. The policies should aim to foster a stable financial and macroeconomic environment in which sustainable growth, which is ultimately driven by supply factors, can take hold. And, to do so, they need to retain sufficient safety margins to deal with unexpected untoward events, as well as inevitable recessions. Ultimately, though, the adjustments call for a shift in mindset, that is, a keener recognition of the limitations of stabilisation policies, which cannot act as engines of growth. Having the region of stability as a conscious and explicit policy consideration would help to guide action.
This chapter lays out the enduring challenge for monetary and fiscal policy to stay within the region of stability and how it might be addressed. The chapter first outlines the role of monetary and fiscal policy as core economic functions of the state and introduces the concept of the region of stability. It then describes the journey of monetary and fiscal policy over the past decades to the boundaries of the region, ushering in high inflation and financial fragility. It next discusses the potential risks ahead for macroeconomic and financial stability. The chapter ends by exploring policy implications.
Policy interactions and the region of stability
As two core economic functions of the state, monetary and fiscal policy play a key role in ensuring economic stability and trust in policymaking. Both policies entail privileged powers to access and reallocate economic resources in society. Fiscal policy hinges on the power to raise taxes and the prerogative to issue debt backed by future tax revenues. Monetary policy wields the power to issue "money", an irredeemable liability of the state used as a means of payment. These powers are mutually reinforcing. The requirement to pay taxes with money sustains money demand, encouraging its use as a payment tool. In turn, a stable monetary system strengthens the tax base. Furthermore, money issuance supports fiscal revenues through seigniorage and can help prevent technical government default as public debt is redeemable against money.
The privileged powers of fiscal and monetary policy ultimately depend on an implicit social contract underpinned by trust in the state. People consent to paying taxes because they trust the government to use the proceeds for the public good. Similarly, people accept the use of money as a means of payment because they trust the central bank to preserve its value.
Box A
The consolidated central bank-government budget constraint
The balance sheets of the central bank and the government are joined at the hip. This, in turn, tightens the link between monetary and fiscal policy and can blur the distinction between them. The balance sheets are intertwined because the central bank is "owned" by the government or is part of it, sending to it remittances based on the institution's financial results. In addition, it is quite common for the two organs of the state to hold claims on each other and issue others that are very close substitutes in private sector portfolios. Examining the link between the two balance sheets sheds further light on the interaction between the two policies.
Consider first the central bank's balance sheet. Its assets typically consist of government securities, claims on the private sector (eg lending to banks) and (often but not always) foreign currency reserves. Its liabilities take the form of own debt (eg own paper or reverse repos) and "monetary liabilities", ie cash in the hands of the public and bank reserves – the "monetary base". Very often, they may also include government deposits. The residual between the value of the assets and liabilities is the central bank's capital. The balance sheet of the fiscal authority includes the central bank's capital as an asset, as well as any other assets held, and liabilities issued, by the fiscal authority.
Consolidating the two balance sheets highlights two important points.
First, large-scale central bank purchases of long-term government
debt amount to a large debt management operation, the nature of which
depends on how the central bank finances them. Since cash is entirely
demand-determined, the central bank can either issue its own short-term
debt – almost indistinguishable from that of the government – or
increase the amount of bank reserves. However, if the central bank wishes to retain control over the interest rate, those reserves must be interest-bearing: the interest rate would fall to zero for as long as those reserves are not reabsorbed. The reserves are, in fact, indexed to the overnight rate.
Second, central bank profits and losses feed through to the government's financial position. This can strengthen or weaken it in ways that would not be apparent if one considered only the government's financial accounts. For instance, the government may lengthen the maturity of its liabilities. But if the central bank purchased an equivalent amount, the corresponding government debt would be, in effect, overnight or short-term. This would raise, not lower, the sensitivity of the fiscal position to higher interest rates. The higher sensitivity would show up as greater interest costs to the central bank and, through lower remittances to the fiscal authority, lower government revenues.
One example helps to illustrate these two points (Graph A1). Assume that the government issues more long-term (fixed rate) bonds to finance the acquisition of long-term assets, such as public infrastructure (Graph A1.A). Next assume that the central bank buys this debt and finances it by issuing remunerated overnight bank reserves (Graph A1.B). Looking at the balance sheet of the government alone, it would appear that the government has lengthened the maturity of its debt and reduced the sensitivity of its funding costs to higher interest rates. In reality, looking at the consolidated balance sheet, it is clear that the sensitivity is now higher, as higher interest rates immediately reduce central bank remittances (Graph A1.C). In case of large capital losses by the central bank, remittances may even become negative.
Graph A1

Considering the evolution of the consolidated balance sheet in
stylised form sheds further light on how fiscal and monetary policies
interact. The budget constraint can be written as follows:
where Dl,t is the consolidated domestic currency debt (including any central bank debt and interest-bearing bank reserves); Df,tEt is the consolidated foreign currency net debt (ie debt minus FX reserves) expressed in domestic currency (Et is the exchange rate); rl,t and rf,t are the corresponding interest rates; PBt is the primary balance (taxes minus spending excluding interest payments); and ΔMt is the change in (non-interest-bearing) monetary liabilities (reserves and cash). All the variables are expressed in nominal terms. Dividing by nominal
GDP and combining the domestic and foreign currency components of net
debt, highlights the factors determining the evolution of the net
debt-to-GDP ratio:
All the variables are expressed in nominal terms. Dividing by nominal
GDP and combining the domestic and foreign currency components of net
debt, highlights the factors determining the evolution of the net
debt-to-GDP ratio:
where pbt and st = ΔMtYt are the primary balance and so-called seigniorage as a share of GDP, respectively, and gt is the growth rate of nominal GDP. Note that the effective interest rate rt is a weighted average of the interest rate paid on domestic and foreign currency debt (with at indicating the share of domestic currency debt in total net debt) and includes valuation effects through the depreciation et of the exchange rate:
 This adds nuance to the ambiguous notion of "monetary financing".
Thus, the consolidated budget constraint highlights that monetary
and fiscal policy are inextricably linked. Higher interest rates as,
say, may be needed to address inflation, weaken the fiscal position and,
if this is precarious enough, can generate strains. By the same token, a
fragile fiscal position reduces the monetary policy room for manoeuvre,
as it makes the control of inflation more costly. Indeed, in the case
of acute concerns about the sovereign's creditworthiness, monetary
policy could even lose control of inflation altogether. The concerns could trigger a run on government debt, capital flight and
a sharp depreciation of the currency, which would generate inflation. A
sharp tightening of monetary policy would simply intensify concerns
about a possible default, especially if part of the debt was denominated
in foreign currency. Even if default was avoided, this would be at the
cost of higher, most likely runaway, inflation. Ultimately, maintaining
low and stable inflation requires fiscal backing.
The concerns could trigger a run on government debt, capital flight and
a sharp depreciation of the currency, which would generate inflation. A
sharp tightening of monetary policy would simply intensify concerns
about a possible default, especially if part of the debt was denominated
in foreign currency. Even if default was avoided, this would be at the
cost of higher, most likely runaway, inflation. Ultimately, maintaining
low and stable inflation requires fiscal backing.
The central bank could also increase a non-interest-bearing reserve requirement, which is a form of tax on the banking system. Here M does not correspond to the monetary base or M0, as the latter also includes interest-bearing reserves.
Specifically, the demand for cash is largely a demand for transactions
balances: it can be thought to depend on nominal income and, with
limited sensitivity, on the nominal interest rate. That for
non-interest-bearing reserves is either minimal or depends on the
factors driving any reserve requirements, typically the deposit base to
which they are related. Deposits, too, can be thought of as a function
of the same variables as cash.
In the majority of episodes of high inflation and hyperinflation, the
root cause was often a fiscal imbalance and/or an unrealistic target for
the exchange rate coupled with an accommodative response of the central
bank. See eg Fischer et al (2002).  The crucial role of fiscal policy in determining inflationary outcomes
is at the heart of the fiscal theory of the price level (FTPL). Any
increase in government debt that is not backed by the credible
expectation of higher future fiscal surpluses creates inflationary
pressures, with default being ruled out as too costly. The underlying
mechanism that pushes the price level up is a wealth effect. See eg
Cochrane (2023) for a description of the FTPL and additional examples.
The crucial role of fiscal policy in determining inflationary outcomes
is at the heart of the fiscal theory of the price level (FTPL). Any
increase in government debt that is not backed by the credible
expectation of higher future fiscal surpluses creates inflationary
pressures, with default being ruled out as too costly. The underlying
mechanism that pushes the price level up is a wealth effect. See eg
Cochrane (2023) for a description of the FTPL and additional examples.
The need to retain society's trust sets limits on the privileged powers of the two policies. Monetary and fiscal policies can become a major force for prosperity if used effectively to provide public goods and to ensure a stable financial and macroeconomic environment, underpinned by a sound payment system. If instead their powers are wielded unwisely, the policies can seriously damage the economy and, ultimately, trust in the state.
The main channels through which monetary and fiscal policies influence economic activity differ considerably. Fiscal policy does so primarily through the direct impact of spending on goods and services, and the production of some of those services, as well as through transfers to households and firms. Monetary policy works primarily through the central bank's operations in financial markets – notably the policy interest rate – which have a pervasive effect on yields, borrowing costs, asset prices and the exchange rate.
That said, overlaps are also substantial. Fiscal policy influences financial conditions through debt issuance. Not only does public debt underpin the functioning of the financial system and the pricing of assets, it can have a far-reaching effect on the yield curve, other asset prices and the exchange rate, as well as on the soundness of the financial system when fiscal soundness is put in doubt. Monetary policy, in turn, influences the state of public finances. It does so directly, by setting interest rates (borrowing costs) and through its effect on the exchange rate (when debt is denominated in foreign currency); and it does so indirectly, through its impact on economic activity and inflation more generally, which can materially alter government expenditures and taxes.
The two policies are further entwined through interlocking balance sheets (Box A). Since the central bank is part of the state, its financial results feed into the financial condition of the government through remittances. The large-scale purchases of government debt, as well as the accumulation of foreign exchange reserves, have made government finances more sensitive to central bank decisions.
The region of stability
The pervasive impact that monetary and fiscal policy have on economic activity, and the overlapping nature of their transmission channels, means that the two policies are joined at the hip. They may work in a coherent fashion to foster a stable financial and macroeconomic environment; but they can, equally, undermine that stability and generate tensions between them that are very difficult to manage.
The concept of the "region of stability" helps identify the appropriate zone of operation of the two policies (Box B).3 This region captures the set of monetary and fiscal policies that are consistent with macroeconomic and financial stability. The boundaries of the region vary across countries and are difficult to pin down with precision ex ante. They cannot be summed up in simple metrics, akin to a constraint on the level of the fiscal deficit or on the policy rate.
Furthermore, the size, shape and locus of the region shift over time. Some changes occur gradually, such as those due to structural developments in the labour market and the structure of production. But the region can also shrink and shift position rapidly, for example due to a sudden loss of confidence in policy or in the economy at large – a risk that has become more acute over time due to the rapid growth and increased fragility of the financial system. This underscores the need for fiscal and monetary policy to operate well within the region and to leave sufficient safety margins at its boundaries.
Box B
The region of stability and its determinants
The region of stability identifies the set of fiscal and monetary
policy combinations which are consistent with macroeconomic and
financial stability.
When fiscal and monetary policies operate within this region, tensions
between the two policies may arise frequently but remain manageable.
However, when fiscal and monetary policies approach the boundaries of
the region, they encroach on each other and endanger macro-financial
stability.
A key challenge for policymakers is that the region of stability evolves over time in size, shape and position (Graph B1.A). In certain periods, the region can be quite extensive, encompassing a broad set of monetary and fiscal settings. But the region can then rapidly shrink. Monetary and fiscal policy combinations that appear consistent with macro-financial stability at a given point in time, may, all of a sudden, no longer be.
Graph B1
Several factors influence the region of stability by changing the
macro-financial backdrop and the degree of public confidence in the
economic outlook and in the soundness of the policy framework (Graph B1.B).
Some of these factors are relatively slow-moving. For example,
structural forces – including technological and financial innovation –
can gradually alter the foundations of production and finance, in turn
shaping the set of monetary and fiscal policies that are consistent with
macro-financial stability. Demographic factors can also slowly but
profoundly change labour markets.
And international trade and financial integration – or forces that work
against it – can heavily influence the global economic landscape and
thus the room for fiscal and monetary policy manoeuvre.
But other factors can evolve much faster, abruptly shifting the
locus and size of the region of stability. One possibility is sudden
exogenous shocks. For example, the commodity price surge triggered by
the Russian invasion of Ukraine provides a vivid illustration of such a
risk. Furthermore, confidence effects greatly heighten the potential for
sudden movements in the region. Market sentiment and public trust in
the ability of macroeconomic policies to preserve stability can shift
rapidly and, in turn, dramatically narrow the fiscal and monetary space.
A sharp depreciation of the exchange rate is often the first sign of a
loss of confidence as well as a key channel that constrains the policy
headroom.
The rapid growth of the financial system in recent decades has made sudden shifts in the region of stability more likely. By becoming more sophisticated and fast-paced, the system has also become increasingly fragile. Leverage and liquidity mismatches have ballooned, in plain sight as well as out of sight. In such a system, confidence can suddenly evaporate, bringing about runs on financial institutions and market breakdowns. This fragility can abruptly shrink the region of stability by limiting the set of fiscal and monetary policy combinations that are consistent with investor confidence.
Besides being affected by structural forces and exogenous shocks,
policies other than monetary and fiscal ones exert a heavy influence on
the region. For example, microprudential and macroprudential regulation
play a critical role in limiting financial excesses and building
precautionary buffers, thus preserving greater space for fiscal and
monetary policy.
A targeted and well calibrated use of foreign exchange rate
interventions, in some situations possibly complemented by capital flow
management measures, may also enhance macroeconomic resilience, and
provide fiscal and monetary policy with greater flexibility.
And structural reforms can considerably expand the region by boosting
potential growth, thereby reducing public pressures for monetary and
fiscal policies to support economic activity.
Yet an even more important – although much less appreciated –
aspect is that the cumulative impact of fiscal and monetary policies
themselves can profoundly alter the region of stability. Policy settings
that may appear stabilising in the near term can, over time,
inadvertently shrink the region. For example, monetary and fiscal
settings with expansionary effects in the short term may come at the
cost of higher instability down the road by encouraging leverage and
risk-taking. Prolonged policy accommodation may also create misperceptions about
economic fundamentals. An extended period of easy monetary conditions
when inflation is held down by favourable tailwinds may provide the
false impression of a permanent and independent decline in real rates
that can lure policymakers towards the region's boundaries.
Prolonged policy accommodation may also create misperceptions about
economic fundamentals. An extended period of easy monetary conditions
when inflation is held down by favourable tailwinds may provide the
false impression of a permanent and independent decline in real rates
that can lure policymakers towards the region's boundaries.
The concept of the region of stability thus underscores the critical intertemporal trade-offs associated with fiscal and monetary policy. In setting policy, policymakers should not only remain firmly within the region of stability but they should also ensure that the cumulative impact of fiscal and monetary settings does not shrink the region over time. Failure to do so can have severe consequences, by dramatically narrowing the space for policy manoeuvre, heightening tensions between monetary and fiscal policies, and ultimately undermining macro-financial stability and trust in the key functions of the state.
See
Borio and Disyatat (2021) for an early discussion on how the region of
stability constrains and is in turn affected by fiscal and monetary
policy.
Structural factors – including rising inequality, an ageing population
and decreases in technological progress – have been proposed as possible
drivers of the decline in real interest rates. See eg the discussion in
Blanchard (2022). Yet the empirical evidence is weak. See Borio et al
(2017).
These concepts are at the centre of the literature on currency crises,
eg Krugman (1979), Obstfeld (1996) and Aghion et al (2004). See eg Farhi and Werning (2016), Cerutti et al (2017), Korinek and Simsek (2016) and Bergant et al (2023). See eg Cavallino and Sandri (2023) and Bianchi and Lorenzoni (2022).
High public and private leverage may, for example, constrain monetary
policy and undermine macroeconomic stability via fiscal and financial
dominance concerns, as articulated for example in Sargent and Wallace
(1981) and Brunnermeier (2015). Evidence regarding the link between
credit growth and subsequent financial crises is presented in Borio and
Lowe (2002) and Schularick and Taylor (2012).
For models in which monetary easing may drive a prolonged reduction in
real interest rates, see Rungcharoenkitkul et al (2019), Mian et al
(2021) and Kashyap and Stein (2023). Evidence about the effects of
monetary policy on long-term real rates is provided in Borio et al
(2019), which also includes a review of the literature.
The cumulative effect of past fiscal and monetary policy decisions crucially shapes the region's boundaries. For example, prolonged periods of monetary and fiscal accommodation may contribute to the build-up of a broad range of vulnerabilities – including greater leverage and risk-taking – that can eventually constrain the policies' room for manoeuvre. Hence the typically intertemporal nature of the trade-offs involved. A policy conduct that may appear stabilising in the near term can, over time, inadvertently shrink the region and take policies towards the boundary. The economic system may appear stable for a long time until, suddenly, it is not.
The boundaries are also approached through the interaction of the two policies. For a given interest rate path, a fiscal policy stance that is cumulatively too loose will risk higher inflation and a sovereign crisis, as debt builds up. For a given fiscal policy path, a monetary policy stance that is cumulatively too easy can generate higher inflation and financial stability risks. Along the corresponding paths, the two policies can reinforce each other's trajectories. Easy monetary policy can induce the government to build up more debt; expansionary fiscal policy can make it harder for monetary policy to be as tight as necessary.

Testing the region's boundaries can trigger vicious cycles. In that case, both policies end up narrowing their respective rooms for manoeuvre, shocks become increasingly damaging and policies increasingly destabilising. The instability, in turn, threatens or reflects loss of trust in the policies themselves. A common feature is loss of trust in money – as a store of value, means of payment or unit of account – and in the sustainability of public debt.
Instability in the wake of overstepping the boundaries of the region of stability can take different forms. Common manifestations include high inflation, economic slumps, sovereign default and financial stress. A sharp depreciation of the exchange rate is a typical symptom and transmission channel. The most acute manifestation of drifting far outside the boundaries is hyperinflations, such as those experienced in some Latin American emerging market economies (EMEs) in the 1980s and 1990s. These show how fiscal pressures and their monetary policy accommodation can destroy the value of money (Graph 2.A).
Another manifestation is the coincidence of sovereign debt, systemic banking and currency crises (Graph 2.B). Acute financial crises often feature the so-called doom loop between the sovereign's balance sheet and the financial sector. In such episodes, fiscal and financial instability reinforce each other, as banks suffer losses on government bond holdings while governments need to shore up the failing banking system. In turn, these fiscal and financial crises undermine trust in the currency, and currency depreciation further exacerbates instability.
Testing the boundaries: the long journey so far
The journey: from the 1960s to today
Prior to the pandemic, monetary and fiscal policy were already approaching the boundaries of the region of stability. Interest rates had been historically low for a prolonged period and central bank balance sheets had risen to wartime-like levels following more than a decade of monetary stimulus in the wake of the Great Financial Crisis (GFC). At the same time, public debt had reached historical highs following persistent fiscal deficits. This constellation meant a substantial loss in room for policy manoeuvre and left economies vulnerable to shocks as well as to the inevitable next recession. Then, when the pandemic – a bolt from the blue – struck, the policies tested those boundaries further, ushering in high inflation and financial fragility.
How did monetary and fiscal policies come to approach the boundaries pre-pandemic? It was the result of a long journey. The journey was not linear. The symptoms of an overly expansionary policy stance evolved with the economic landscape that those policies were helping to shape, together with more fundamental structural forces. A consistent underlying factor was the overestimation of how far macroeconomic policies could steer the economy and, by pushing hard enough, ignite the engine of growth – a kind of "growth illusion". This induced a progressive loss of policy space over time.
It is useful to divide the journey going back to the 1960s into two phases, with the mid-1980s as a rough watershed. Graph 3 illustrates the break, with reference to advanced economies (AEs) – see below for a discussion of similarities and differences with EMEs.
Until the mid-1980s, the key symptom indicating that the policies were testing the speed limits of the economy, and hence the boundaries of the region of stability, was rising inflation. Recessions were typically induced by a tightening of monetary policy to quell inflation. With the financial system hemmed in by regulation, signs of large build-ups and contractions in credit were missing. During this phase, the drift to the boundaries reflected, in part, the belief that policymakers could fine-tune the economy by a carefully calibrated mix of monetary and fiscal policy. Hence the concept of a stable long-run trade-off between unemployment and inflation. The result was the Great Inflation of the 1970s.
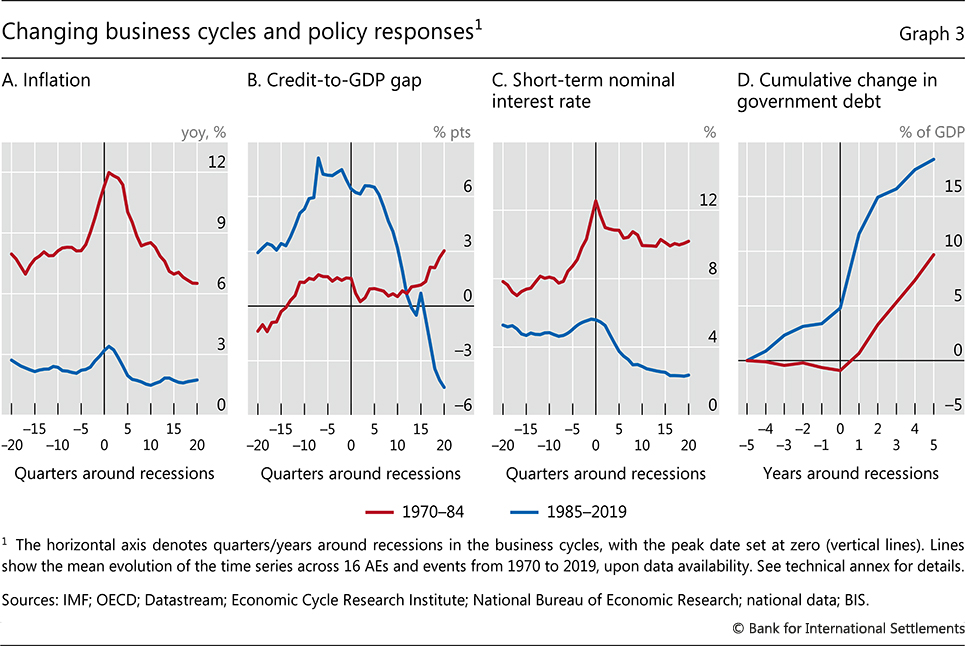
In response to the inflation crisis, policymakers took steps to bring monetary and fiscal policies back within the region of stability. Central banks sought to end inflation by aggressively hiking policy rates. Following the disinflation in the first half of the 1980s, monetary regimes prioritising price stability gradually became the norm. Interest rates declined substantially from their previous peak. However, the rise in interest rates on the back of monetary tightening in the early 1980s had exposed fiscal fragilities in many countries. In combination with persistent fiscal deficits, this led to a surge in public debt. Thus, many governments were forced to embark on fiscal consolidation. For more than a decade from the early 1990s, public debt levels, on average, stabilised.
The beginning of the second phase in the mid-1980s reflected, paradoxically, the confluence of these improvements in policy frameworks with fundamental structural change. The combination altered business cycle dynamics in subtle but far-reaching ways. Financial systems were profoundly liberalised. By the early 1990s, a "government-led" financial system had given way to a "market-led" one, both domestically and internationally.4 And the globalisation of the real economy soon followed. EMEs, most notably China, joined a seamless global labour force and tight production networks spread across the world.
As a result of these changes, inflation ceased to be the main symptom of policies testing the boundaries of the region of stability. Central banks secured price stability as the globalisation of the real economy was eroding the pricing power of workers and firms. This was a powerful structural tailwind, which helped central banks hardwire the low-inflation regime and meant that a given inflation rate would be consistent with lower real and nominal interest rates. It was the era of the Great Moderation.
The symptoms of overstretch now took the form of financial imbalances, ie outsize expansions in credit and asset prices, notably real estate prices, on the back of strong risk-taking. Inflation-induced recessions gave way to financial recessions. Inflation was on average low and stable and barely rose prior to business cycle contractions, while falling mildly but persistently below the pre-recession level in their wake. Instead, business cycles featured sharp pre-recession financial expansions that turned into contractions. The recessions became commonly associated with financial stress or, with prudential regulation failing to adjust to the new environment, even outright crises, most spectacularly the GFC. These recessions had a longer-lasting impact on growth, as the economy laboured under a legacy of higher debt,5 thereby also biasing traditional cyclical adjustment measures.
Over time, the shift from inflationary pressures to financial imbalances contributed to the gradual erosion of policy space. Monetary policy naturally eased during contractions to cushion the economy and fight the headwinds of private sector balance sheet repair. But it had little reason to tighten much during expansions since inflation remained low and stable. Interest rates progressively declined. For fiscal policy, the GFC was a watershed. The outsize financial boom that preceded it greatly flattered government accounts by artificially raising estimates of potential output and boosting tax revenues, thereby disguising the more expansionary stance.6 Financial crises then forced sovereigns to backstop the financial system and support faltering economies, as some countries had already done in the banking crises of the 1990s. Public debt initially increased massively, sustained by low interest rates that kept a lid on debt servicing costs.
The challenges intensified in the aftermath of the GFC. Monetary policy struggled to push inflation back up to target: the globalisation tailwinds that had helped to bring inflation down to target pre-GFC were hindering the central banks' efforts to push it back up. Fiscal policy did seek to regain some of the room for manoeuvre lost in the aftermath of the GFC. But, as a result, monetary policy became the "only game in town". As time wore on, fiscal policy was then asked to support monetary policy in the fight against low inflation by boosting economic activity. It was a topsy-turvy world compared with the one that had preceded it.
The pandemic gave the final push towards the boundaries. All the policy stops were pulled out to shield households and firms from the full force of the lockdowns put in place to deal with the Covid-19 health emergency. Ostensibly, they could stretch the room for manoeuvre further, but the risks were material. At least with the benefit of hindsight, the support proved to be too large and prolonged. Inflation surged on the back of such macroeconomic stimulus when the economy rebounded with surprising vigour as restrictions were lifted and when supply failed to respond in a sufficiently elastic way.7 And this took place against the backdrop of historically high levels of public and private debt, as well as elevated asset prices. For the first time, globally, a surge in inflation coincided with widespread financial vulnerabilities (Chapter I).
The journey: reinforcing effects
Along the journey towards the boundaries of the region of stability, a number of factors reinforced the trajectories of fiscal and monetary policy.
Arguably, one such factor was the waning traction of policies as they approached the boundaries. Changes in policy rates tend to have a smaller effect on aggregate demand when nominal interest rates are very low (Graph 4.A), reflecting, for example, negative income effects on savers and the adverse impacts on bank profitability of persistently low rates.8 This loss of traction implies that larger interest rate cuts are needed to produce the same impact on output and inflation, pushing monetary policy closer to the boundary of the region of stability. Moreover, the side effects of monetary easing through higher risk-taking and private debt build-up tend to become stronger when interest rates are low and stay there for a long time, narrowing the region of stability.9
Fiscal stimulus also tends to become less powerful when public debt is higher. This likely reflects adverse confidence effects that kick in when doubts about fiscal sustainability grow. Therefore, larger fiscal measures are required to achieve the same stimulus as debt trends up.10
The self-reinforcing interactions between the two policies constitute a second important factor. Lower interest rates reduced fiscal constraints, diminishing the need and incentive to consolidate in economic expansions. Reductions in the interest rate paid on the debt have indeed been associated with an increase in fiscal deficits, especially during the post-GFC period of ultra-low interest rates (Graph 4.B). Central bank large-scale asset purchases of sovereign debt played a key role in this respect. Across advanced economies, central bank holdings of government debt soared post-GFC (Graph 5.A), driven primarily by large-scale bond purchases of major central banks (Graph 5.B).
High public debt levels, in turn, probably reinforced incentives to maintain an accommodative monetary stance. When debt levels are high, interest rate hikes have a stronger impact on debt servicing costs, raising more acute concerns about adverse macro-financial and fiscal repercussions. By the same token, central bank balance sheet normalisation becomes more difficult when public debt is high because markets must absorb larger amounts of debt. These factors may have made it harder to tighten monetary policy and shrink central bank balance sheets – a kind of "debt trap".
The journey: how different are EMEs?
The journey of EMEs has several similarities to that of AEs. It was shaped by the same global forces that affected business cycles over time. For one, financial liberalisation – sometimes country-specific – elevated the role of financial cycles and increased the incidence of banking crises. Prominent examples include the Southern Cone crisis in Latin America in the early 1980s, the Tequila crisis in Mexico in 1994 and the Asian crisis of 1997–98. In addition, the globalisation of the real economy weighed on inflation from the 1990s on, reinforcing the impact of the adoption of price stability-oriented monetary policy regimes. These basic similarities are reflected also in the broad evolution of key variables such as inflation, interest rates, fiscal deficits and public debt (Graph 6).
At the same time, there are also important differences, including among EMEs, related to structural factors.
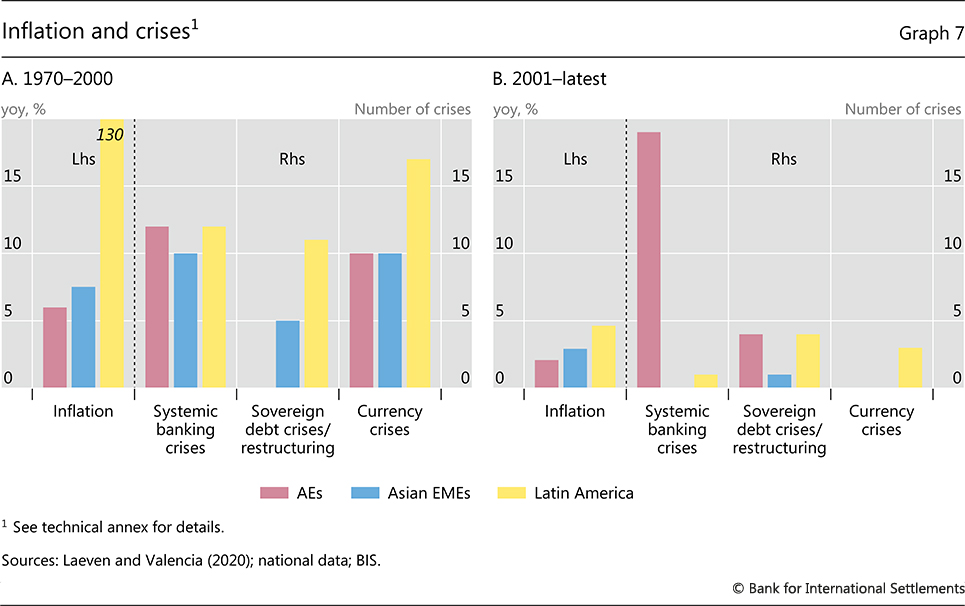
Some of these factors have mainly influenced differences in the journey across EME regions. Political and institutional features can shape attitudes towards fiscal policy, inflation and growth. Partly as a result, inflation has been structurally lower in Asia than in Latin America, which saw hyperinflations in the 1980s and 1990s, often combined with sovereign default and financial stress (Graph 7).11
Other structural factors drive differences, mainly, between EMEs and advanced economies more generally. A key such factor is EMEs' greater sensitivity to global financial conditions and market sentiment. This greater sensitivity reflects, primarily, less developed financial markets, including fewer FX hedging possibilities, and greater reliance on FX funding.12 It has four main implications.
First, the region of stability is smaller and more fluid. The margin of error is commensurately narrower and the risk of sudden and abrupt discontinuities higher. As a result, when policies step outside the region of stability, market discipline is typically felt earlier and more intensely than in AEs, forcing a rapid shift back.13
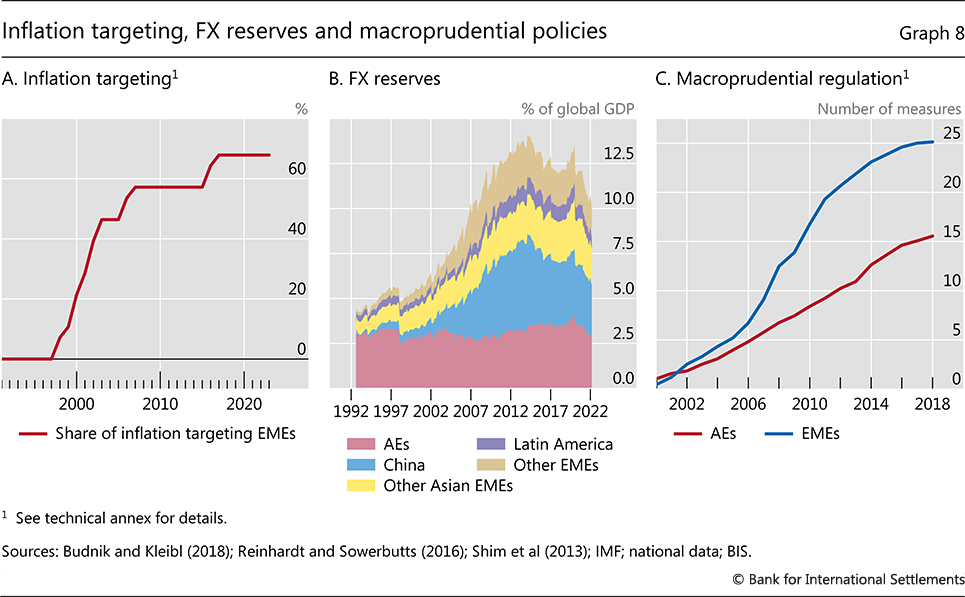
Second, the symptoms of breaches of the boundary of the region more often take the form of capital outflows and large depreciations. The exchange rate plays a bigger role, as a force behind fiscal fragility, inflation and financial instability. And given the greater prevalence of fixed or tightly managed exchange rate regimes until the late 1990s, the incidence of currency crises has been higher. This has prompted a shift over time towards more flexible exchange rate arrangements, accompanied by a widespread adoption of inflation targeting frameworks (Graph 8.A).14
Third, the impact of monetary policy in AEs, notably in the United States, given the dominant role of the US dollar, has been especially prominent. Changes in the US monetary policy stance and swings in the US dollar have been major forces behind the ebbs and flows of global conditions. For example, the Volcker disinflation triggered the Latin American debt crisis, characterised by financial fragilities that had been amplified by strong capital inflows linked to the recycling of petrodollars. The shift to more flexible exchange rate regimes has attenuated, but by no means eliminated, this influence.15
Fourth, the greater exposure to global financial conditions and repeated crises has, over time, fostered EMEs' awareness of the boundaries of the region of stability and their fluidity. From the late 1990s, well before the GFC, they took steps to strengthen their policy frameworks, complementing flexible inflation targeting with a more active use of FX intervention (Graph 8.B), macroprudential tools (Graph 8.C), as well as, to a lesser extent, targeted capital flow management measures – key elements of macro-financial stability frameworks.16 Again, regional differences emerged, with greater concerns about domestic financial imbalances and a lower degree of exchange rate flexibility in Asia than in Latin America.
These enhanced policy frameworks have allowed countries to more successfully weather the GFC and the Covid crises (Graph 7) by increasing shock resilience and enabling countercyclical policies in bad times. They also help explain, for example, why countries in Latin America have tightened monetary policy earlier and more forcefully than many of their AE peers post-Covid. At the same time, these improvements have also somewhat relaxed the policy constraints the countries faced, widening the perceived region of stability. This is, in turn, not without risks going forward and could partly account for the deterioration in fiscal positions and ratings post-GFC (see Graph 6 and below).
Testing the boundaries: risks in the journey ahead
What is the next step in the journey of AEs and EMEs? What are the implications of having tested the boundaries of the region of stability? The ongoing struggle to restore price stability and fend off financial stability risks has triggered tensions between fiscal and monetary policy that raise further challenges down the road.
Three main interrelated challenges stand out. First, public finances are facing major strains owing to the combination of record high levels of public debt, strong spending pressures, higher interest rates and weakening growth prospects. Second, large fiscal deficits and high public debt are at risk of working at cross purposes with monetary policy tightening, potentially complicating the fight against inflation. Third, the deterioration in public finances and the sharp repricing of long-term debt in the wake of interest rate hikes may raise financial stability risks.
Consider each issue in turn.
Risks to fiscal positions and the sovereign's creditworthiness
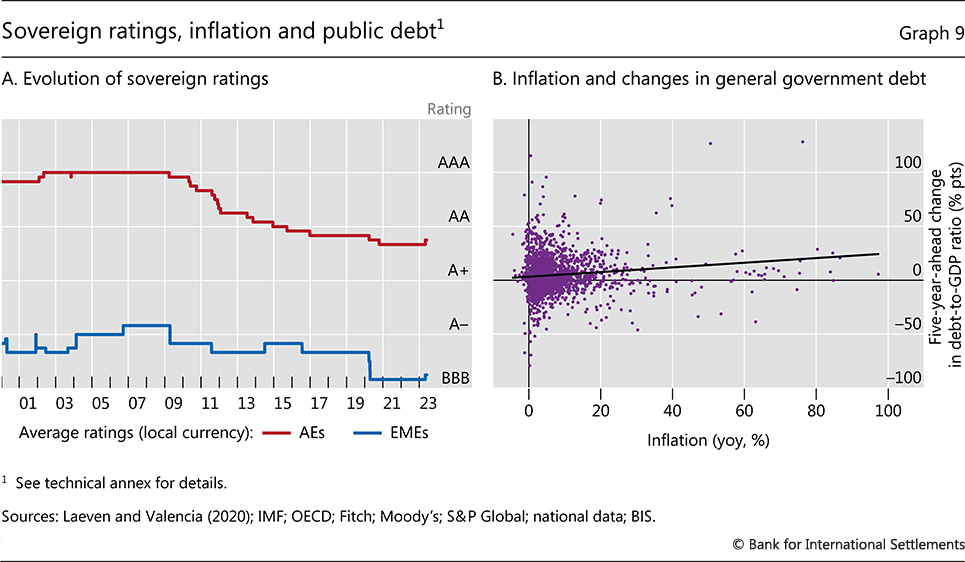
The increase in public debt in AEs and EMEs has led to a deterioration in sovereigns' creditworthiness (Graph 9.A). In AEs, sovereign credit ratings worsened considerably following the surge in debt levels in the wake of the GFC. In EMEs, credit ratings have gradually deteriorated during the past decade in line with the increase in debt levels.
The unexpected inflation surge after the Covid-19 pandemic has temporarily embellished fiscal accounts by boosting nominal GDP and thus mechanically reducing debt-to-GDP ratios. Inflation has also flattered fiscal balances. Since many taxes are levied in proportion to nominal variables – such as wages, sales etc – they tend to increase immediately as prices rise. By contrast, public expenditures are largely fixed in nominal terms from year to year.
Yet improvements in fiscal balances due to inflation are ephemeral. Rising costs will feed into higher public spending and governments will confront pressures to raise public wages and social transfers in line with price increases, if this is not already occurring automatically through indexation mechanisms. Furthermore, the monetary tightening required to bring inflation down will increase borrowing costs and constrain economic growth. Indeed, the historical experience shows that periods of higher inflation tend to be followed, if anything, by rising – not declining – public debt (Graph 9.B).
Looking ahead, fiscal authorities will confront severe challenges due to large new spending pressures, the possibility of higher medium-term interest rates and dimmer growth prospects.
First, consider the implications of new spending pressures for the path of public debt going forward. Estimates for AEs and EMEs suggest that age-related expenditures will grow by approximately 4% and 5% of GDP, respectively, over the next 20 years. Absent fiscal consolidation, this would push debt above 200% and 150% of GDP by 2050 in AEs and EMEs, respectively, even if interest rates remain below growth rates, as was the case in the pre-pandemic years (Graph 10).
Other factors may add to the pressure on public finances. The commitment to supporting a transition towards a sustainable global economy in response to climate change is one. In addition, geopolitical tensions are likely to lead to a material increase in defence spending. An illustrative scenario that includes a rise in public spending by 2% of GDP on top of the increase in age-related spending, would lead to an additional increase in public debt of approximately 50% of GDP by 2050.
These worrying debt projections are, in fact, rather optimistic: they assume that real interest rates will remain 1 percentage point below growth rates, broadly in line with the experience in recent years. As is well known, this configuration tends to ease debt sustainability pressures (Box C).
Indeed, there are two important reasons why it would be imprudent to count on large and permanent negative differentials between interest rates and growth rates. First, inflation may prove stubborn and require higher interest rates for longer than currently expected. High inflation may also lead to a re-assessment of inflation risk, prompting investors to demand higher risk premia to hold government bonds. And attempts to regain price stability may ultimately result in a substantive economic slowdown.
Second, the link between structural factors and low real rates, which is often relied upon to project persistently low interest rates, is not watertight.17 The economy may thus exit the current period of high inflation by confronting a new reality with higher real rates.
Should real rates increase on a sustained basis, public debt sustainability would come under further considerable pressure. Two factors compound the effect of interest rate hikes on public finances.
Box C
Fiscal limits and the risks to debt dynamics
A substantial part of the recent debate on public debt and fiscal
sustainability revolves around the idea that a persistently negative
differential between the interest paid on public debt and the growth
rate of the economy – the so-called interest-growth differential, or, in
jargon, r – g – is a boon for public finances. The reason is
that it helps preserve debt sustainability irrespective of the fiscal
stance. While this is never portrayed as a call for reckless fiscal
spending, it does provide some comfort that spare fiscal capacity can be
tapped in case of need and encourages more expansionary policies. The degree of comfort, however, can easily be misleading, with material risks.
Historically, a negative interest-growth differential has been relatively common (Graph C1.A). The prolonged period of average positive differentials in advanced economies starting in the 1980s is more of an exception.
But the same is true of the relatively low volatility of the
differential since the 1990s. Indeed, historically, adjustments in
interest-growth differentials have been abrupt and unpredictable.
Textbook approaches to fiscal limits are based on a stylised budget constraint of the narrow government sector and rely on the relationship that outlines the accumulation of public debt (see also Box A):
where Dt is the nominal amount of outstanding debt at time t,rt is the effective interest rate paid on outstanding debt and PBt the primary balance (including central banks' remittances to the government). Dividing by (nominal) GDP, rearranging terms and approximating, one obtains:
where dt and pbt are, respectively, public debt and the primary balance expressed as a ratio of GDP, and gt is the growth rate of real GDP between t and t – 1. According to equation (2), the dynamics of the debt-to-GDP ratio depend on three key variables: interest rates, nominal growth and net government revenue (the primary balance).
Equation (2) can also be used to determine the adjustment path towards a "long-run" debt level d* from any given starting point and over any time horizon. In the medium run, net of temporary and cyclical factors, rt and gt are assumed to fluctuate around (possibly slowly time-varying) levels r* and g*. The equation can then be solved to determine a long-run value for the debt-stabilising primary balance, that is:
this can be taken as the value around which (countercyclical) fiscal policy should be conducted to maintain debt at the level d*, once cyclical factors have played out.
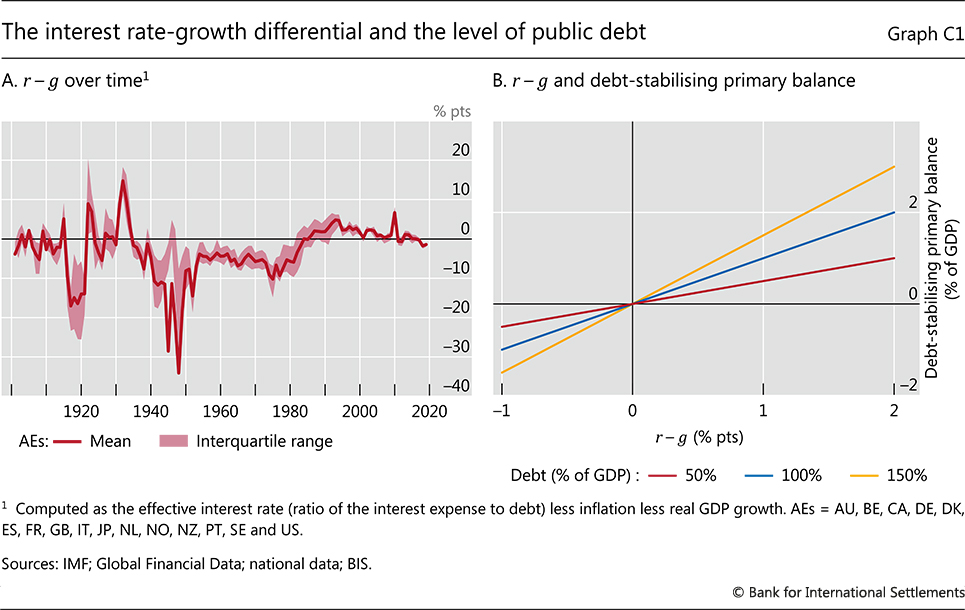
Focusing first on the case r* > g*, higher long-run debt levels require the government to run increasingly high primary surpluses to offset interest payments. But there are limits to running large primary surpluses for extended periods. From a purely economic standpoint, taxes cannot be raised indefinitely without generating incentives to evade taxes, eventually eroding the tax base – the so-called Laffer curve effect. And even more importantly, from a political economy perspective, taxes cannot be raised at will without provoking a backlash, nor can public expenditure be cut below certain limits without jeopardising the provision of basic public services. All these factors imply that there is a limit on the maximum sustainable primary balance, which, together with r* and g*, also establishes an upper limit on public debt – the so-called debt limit.
Keeping in mind the uncertainty of r – g and its
sensitivity to the dynamics of debt also helps to avoid the pitfalls of
drawing strong inferences from the above stylised identity. It follows
that the conclusion that any level of public debt can be sustained when r < g
is incorrect. Even if the relationship appears to hold, it does so for a
given state of the economic environment, including the level and
expected path of public debt: there is no guarantee that r will remain below g
once the fiscal stance changes. Uncertainty and endogeneity can, in
fact, turn a deceptively safe spot into a situation in which fiscal
consolidation is required.
Spikes in yields can occur suddenly in response to adverse events, and a
high level of indebtedness makes them more likely. Moreover, even if
changes in the interest-growth differential are more gradual, the
government may find itself constrained in adjusting its fiscal stance.
Two factors could get in the way.
The first is a high level of debt. On one hand, this amplifies the reaction of yields to adverse shocks.
On the other hand, it magnifies the effects that changes in the
interest-growth differential have on the debt-stabilising primary
balance. In other words, with higher debt, a given increase in r – g
will require a larger adjustment to the primary balance. This is
illustrated in Graph C1.B,
which shows the relationship between primary balances and debt, as
sketched in equation (3). For example, if r increases by 2 percentage
points, the necessary increase in the primary balance is just 1
percentage point when debt is 50% of GDP, but it is three times as high
when debt is 150% of GDP.
Such a large adjustment may not be feasible due to the political
economy constraints mentioned above. And even if technically feasible,
investors may question the ability of the government to stick to a
painful plan: in the end, their assessment of debt sustainability may
rely more on their perceptions of the effective capacity of the
sovereign to collect more taxes and/or cut expenditures than on
estimates of r – g. This could trigger a credibility crisis and a full-blown run on public debt.
Another source of risk is the maturity structure of the stock of public debt. A comparatively shorter maturity of public debt means higher refinancing needs and a higher sensitivity of rt to changes in market rates. This amplifies the magnitude of sudden increases in the interest-growth differential due to changes in interest rates. Typically, a worsening in sovereign risk goes hand in hand with higher risk premia and a shortening of new bond issuance, as the cost of refinancing at longer horizons is higher. This, in turn, increases rollover risks and makes a run on debt more likely. Furthermore, as fiscal accounts become more sensitive to interest rate changes, this could hamper the ability of monetary policy to control inflation.
In practice, estimating the debt limit is a daunting task. First of
all, it is unclear where one should place the limit on primary
balances. Historical experience suggests that primary surpluses are
unlikely to exceed 5% for extended periods. Yet country- and
episode-specific circumstances can play a large role in determining such
a threshold, which should be taken with a pinch of salt.
Second, there is considerable uncertainty about the possible evolution
of future interest rates and GDP growth rates. Finally, and more
importantly, they are also likely to be interrelated and endogenous to
debt itself. Higher indebtedness is likely to be associated with higher
risk premia, and hence higher interest rates to be paid on public debt.
Moreover, there is some evidence that high public debt can be associated
with lower growth. Accordingly, the only reasonable approach to gauging fiscal limits is
to use stress tests or to compare the effects of alternative
assumptions.
Accordingly, the only reasonable approach to gauging fiscal limits is
to use stress tests or to compare the effects of alternative
assumptions.
All in all, running public finances in a region that is closer to the limits increases the risk of abrupt adjustments that could derail the economy. A prudent approach is called for.
See eg Blanchard (2019). However, recent research argues that what
matters for the sustainability of public debt is not only the
interest-growth differential, but also the difference between the
marginal product of capital and the growth rate of the economy, see eg
Reis (2021).
One possible reason is that, when creditworthiness is preserved, public
debt can provide investors with liquidity and safety, and hence trades
at a premium over other riskier and less liquid assets. See also Mauro and Zhou (2021).
For example, Mian et al (2022) argue that the debt sustainability
condition needs to be explicitly complemented by a term accounting for
the sensitivity of interest rates to the debt level.
For example, Lian et al (2020) show that the probability and the size
of reversals in r – g are related to the size of public debt and the
share of foreign currency debt. Note that a similar scenario could be one in which inflation surges and the central bank struggles to control it. See Eichengreen and Panizza (2016). Threshold effects of debt on growth are also used by IMF (2018).
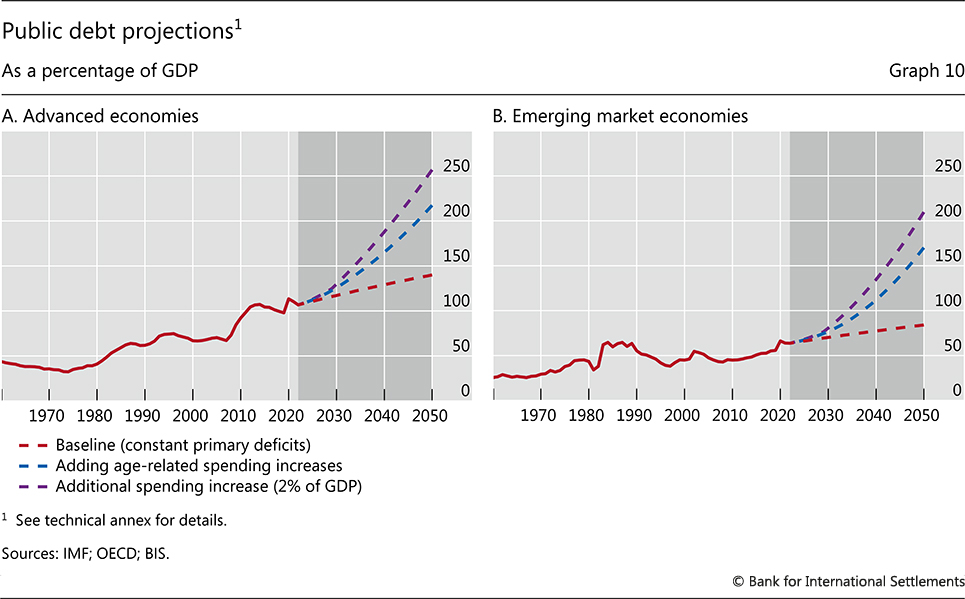
The first is the post-GFC large-scale government bond purchases implemented by several central banks. These purchases – which amounted to 25–50% of the outstanding stock in major AEs (Graph 5.B) – were financed with central bank reserves, thus shortening the maturity of the consolidated public debt. This implies that higher interest rates transmit much faster to public finances via reduced remittances from central banks. Indeed, after accounting for approximately 6% of interest payments on public debt in 2010–20, central bank transfers to governments in AEs have already declined to zero in most countries (Graph 11.A).
The second, much more general factor is the historically high levels of public debt, which means that higher interest rates can lead to a large increase in debt service costs. For example, should interest rates return to levels prevailing in the mid-1990s, interest rate payments on public debt would, over time, surge above 6% of GDP – the highest level in the post-World War II period (Graph 11.B).
Pressures on public debt would increase further should medium-term growth prove disappointing. Global growth prospects are the weakest in decades owing to several structural forces, including geoeconomic fragmentation, slower labour force growth, and slowdowns in China and other EMEs.18 In addition, risks to fiscal positions may themselves weaken economic prospects and raise the risk of adverse non-linear effects. For example, high public debt may constrain the ability of fiscal policy to operate countercyclically during recessions. This could erode confidence in the economic outlook, thus reducing private investment and growth. In turn, weaker growth prospects may exacerbate fiscal risks, increasing risk premia and further undermining economic activity. Countries with higher public debt levels thus tend to experience shorter phases with interest rates lower than growth rates, as well as a higher probability of a reversal.19
In EMEs, the potential for vicious circles between fiscal sustainability, slowing growth and rising interest rates is higher. One key reason is that exchange rate reactions can suddenly push countries to bump up against debt limits. Loss of confidence in debt sustainability can trigger sharp depreciations that, in the presence of currency mismatches can wreak havoc on public and private balance sheets, leading to exploding debt service costs and severe recessions.
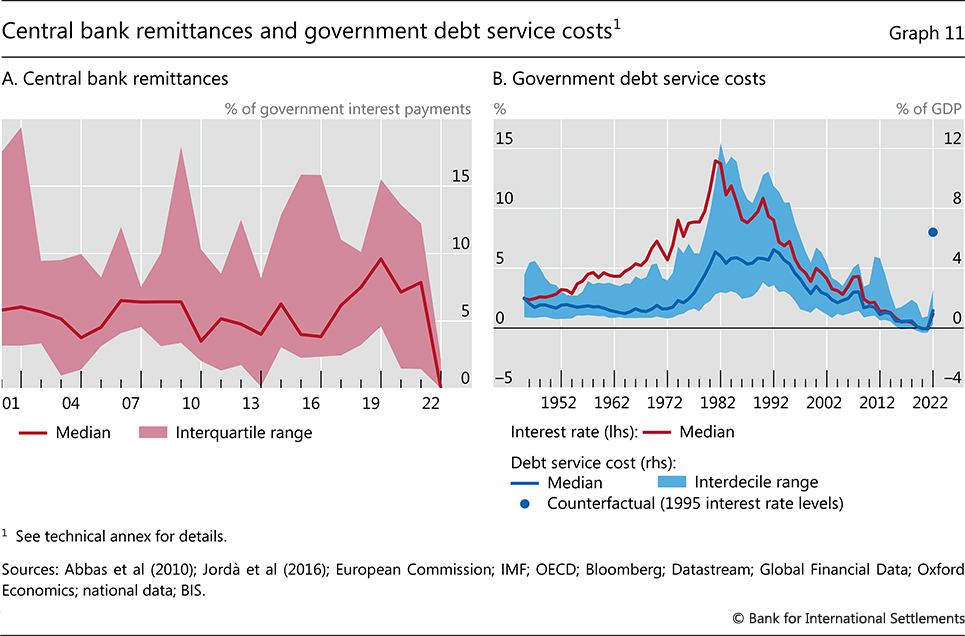
Inflation risks
Pressure on fiscal positions and sovereign risk may increase inflation risks going forward.
In the near term, fiscal deficits remain large in many countries, thus sustaining aggregate demand and inflation. Hence, monetary and fiscal policy are at risk of working at cross purposes, complicating the fight against inflation (Chapter I). This heightens the risk of transitioning to a high-inflation regime – a concern that becomes more acute the longer inflation remains elevated.
Taking a long-term perspective sheds further light on these risks. The evidence indicates that the inflationary effects of fiscal policy depend on the fiscal and monetary policy regime. In AEs, if fiscal policy is prudent – leaning against public debt increases through higher primary balances – and central banks are independent, fiscal stimulus has modest effects on inflation (Graph 12.A).20 But if fiscal policy fails to stabilise debt (ie is profligate) and central bank independence is questioned, the inflationary effects of fiscal policy are much stronger.
The effects of fiscal stimulus on inflation tend to be greater in EMEs (Graph 12.B). This is largely due to the role of the exchange rate. In advanced economies, fiscal stimulus tends to have no significant effect on the exchange rate. By contrast, fiscal expansions in EMEs trigger a significant depreciation of the exchange rate.21 In turn, exchange rate depreciations feed into higher inflation, and to a larger extent than in advanced economies (Graph 13.A).
The transmission of fiscal stimulus to exchange rates in EMEs largely reflects concerns about sovereign risks. Fiscal expansions are associated with increases in sovereign risks, as captured by credit default swap (CDS) spreads (Graph 13.B). These increases, in turn, trigger depreciations (Graph 13.C). In this respect, exchange rates act as the proverbial canary in the coal mine, being highly responsive to the first signs of macroeconomic instability. Beyond feeding back into higher domestic prices and thus undermining efforts to contain inflation, exchange rate depreciations can also pose considerable financial stability concerns.
Beyond the impact of fiscal deficits on inflation, high levels of debt may also play a role by constraining the room for manoeuvre of monetary policy. The most acute concern is the risk of fiscal dominance, ie a situation in which monetary policy is unable to tighten due to fiscal constraints (see also Box A).22 Fiscal dominance can arise for two reasons. In some cases, the central bank is subject to political economy pressures to expand fiscal space by keeping interest rates low. In other circumstances, monetary policy faces an economic constraint because interest rate hikes risk precipitating a sovereign debt crisis.
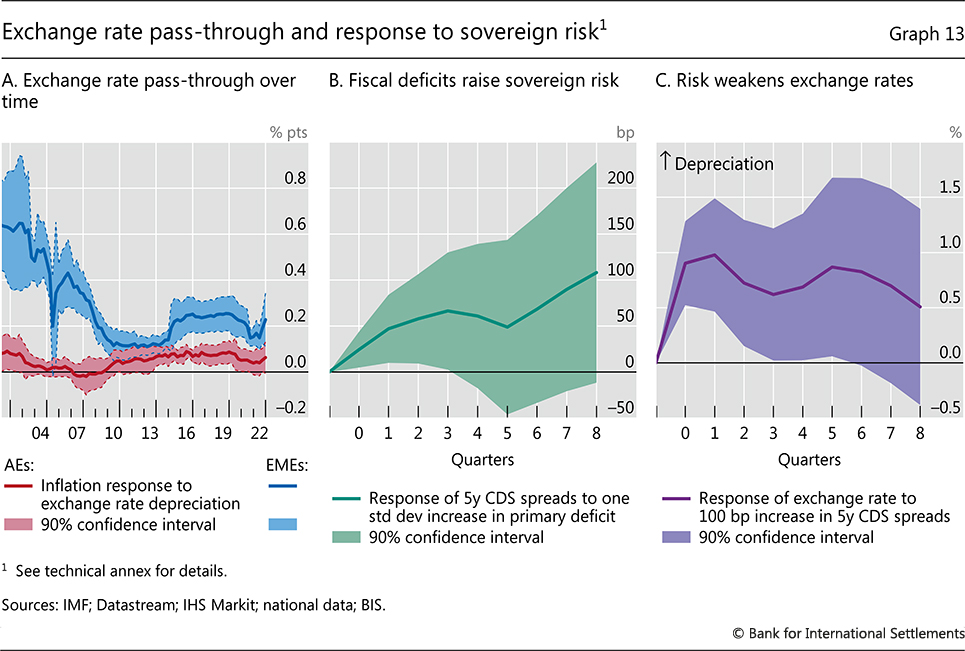
While the two types of dominance tend to go hand in hand and can undermine the central bank's credibility and independence, they have somewhat different implications. Strong institutional safeguards designed to shield the central bank's operational autonomy can be effective when pressures are purely of a political nature. By contrast, they can do relatively little when the constraint is economic and reflects trade-offs linked to higher rates.
Even if high debt levels do not lead to outright forms of fiscal dominance, they may still contribute to raising inflationary pressures. For example, survey evidence suggests that high public debt increases household inflation expectations, especially among people that have less confidence in the central bank's determination to fight inflation.23
Financial stability risks
The deteriorating sovereign debt outlook in many economies also points to heightened risks for the financial sector. Ultimately, a vulnerable sovereign means a vulnerable financial system. There are two reasons for this, over and above any negative effects on the financial system generated by adverse macroeconomic outcomes.
The first reason is that, most directly, the financial system is exposed to the sovereign. To be sure, sovereign debt can be a cornerstone of a well functioning financial system. It can underpin the system's smooth functioning, by providing a safe store of value, a solid benchmark for the pricing of assets and a liquid asset that facilitates economic transactions, not least in its role as collateral (eg for repos or to meet margin calls; Box D). Moreover, government debt is a key instrument through which the central bank sets interest rates and implements monetary policy. At the same time, for government debt to fulfil such functions effectively, it is essential that it retains the highest credit quality and that financial institutions manage the associated interest rate risks properly. Otherwise, it can easily turn from a source of stability into one of major instability.
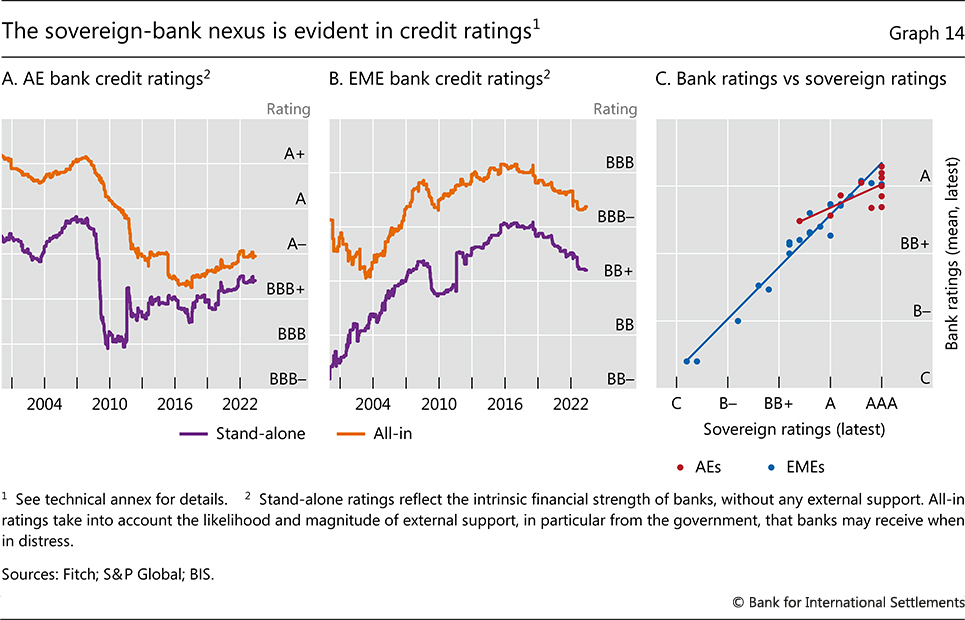
Box D
Government debt as collateral and market functioning
Government debt plays a key role in the financial system. It is typically the domestic currency asset with the highest credit quality. It is traded in the deepest and most liquid markets, and provides the benchmark for pricing virtually all other assets. It is the main instrument that central banks use in their liquidity management operations to set policy interest rates or, through large-scale asset purchases, to influence asset prices more broadly. And, increasingly, it is a primary form of collateral.
The use of government securities as collateral, broadly defined, is an integral part of market participants' risk management and underpins vast financial markets. Government paper is extensively used to post margins in derivatives transactions to reduce counterparty credit risk (Graphs D1.A and D1.B). And it is the instrument of choice in repurchase agreement (repo) transactions (Graph D1.C), which involve the exchange of securities for cash for a pre-defined period. Repos are functionally equivalent to borrowing/lending against collateral.
Several reasons explain the use of government debt as collateral.
First, policymakers' objective of boosting the depth and liquidity of
government bond markets was a key motivation behind the development of
repo markets.
Second, lenders' preferences to substitute relationship finance with
arm's length finance naturally shift the focus from the creditworthiness
of the counterparty or borrower to the quality of the asset used as
collateral. Third, post-GFC regulatory and financial system reforms have
incentivised the use of collateral as an additional risk mitigant.
Government paper has thus acquired the status of "quasi-money". It competes with cash – mostly bank deposits or bank reserves with the central bank – in derivatives margins (Graph D1.B). And, through repos, holders can raise cash without having to sell the underlying security. In fact, haircuts in core safe government bond markets are often tiny or non-existent, in the range of 0–2%. This means that an investor can raise almost as much cash as the value of the government paper they hold.
This quasi-money property of government paper puts a premium on it retaining the highest credit quality. Conversely, deteriorating perceptions about sovereign credit risk and the attendant rise in haircuts can generate major market dislocations, as was evident during the euro area sovereign debt crisis. But, even short of that happening, the pervasive use of government paper as collateral can have major implications for the dynamics of markets under stress.
One reason is rooted in the system's procyclicality. In good times, the availability of collateral and compressed margins can contribute to the build-up of vulnerabilities. As leverage and liquidity mismatches expand, the perceived need to screen and monitor the creditworthiness of counterparties declines, thus leading to a build-up of credit risk, paradoxically when risks seem particularly low on the surface. In bad times, as risk materialises and/or market volatility picks up, spikes in haircuts and margins put a premium on the safest and most liquid forms of collateral, such as government paper. This can set in motion fire sales of less liquid assets to satisfy collateral needs. In the extreme, liquidity strains can degenerate into outright solvency concerns.
A second reason is that, while the use of government paper as
collateral may be compelling at the level of each individual agent,
widespread use may ultimately undermine this paper's safe haven status
and generate systemic events. A certain "fallacy of composition" would
be at work, whereby an initial decline in the value of collateral
induces many market participants to sell it at the same time, thus
giving rise to destabilising price dynamics.
One possible trigger is an unexpected tightening of monetary policy.
This is what occurred, for instance, during the bond market crash of
1994, when highly leveraged positions in government paper were unwound.
Another possible trigger is escalating concerns about inflation. Such
concerns appeared to play a role in the recent stress in UK gilt
markets. Following a fiscal announcement that pointed to a highly
expansionary stance, government paper was sold and the drop in its price
was amplified by the deleveraging of investment vehicles on which
pension funds had been relying to hedge the duration risk of their
liabilities.
The potential for unintended consequences of widespread collateral use carries policy messages. In particular, there is a strong case for imposing higher collateral haircuts and margins that limit the increase in leverage during good times and dampen the ensuing contraction in bad times. While such measures to contain procyclicality would still exploit the risk-mitigating properties of collateral, they would reduce the likelihood of liquidity shortages or declines in collateral values that necessitate central bank interventions.
See for instance CGFS (1999). BCBS (2013, 2020), BCBS-IOSCO (2020) and FSB (2017). See also Aramonte et al (2022). Borio and McCauley (1996). Aramonte and Rungcharoenkitkul (2022).
Historically, the spectre of a loss of sovereign creditworthiness has been a major source of risk for the financial system. In the extreme, the sovereign can default on its debt, causing large losses for debt holders.24 Even in the absence of default, a serious erosion of sovereign creditworthiness can trigger stress and higher risk premia in the government bond market. This propagates to banks, other financial institutions and capital markets, weakening balance sheets and tightening funding conditions, possibly even precipitating a crisis.
The second reason why a vulnerable sovereign can threaten the financial system is that the government provides the ultimate backstop for the system. Of course, prudential regulation and strong standalone resolution mechanisms are the first line of defence. Moreover, central banks can act as lender of last resort and market-maker of last resort in times of severe stress, thereby buttressing the liquidity of the system. But only the government can backstop the system's solvency, through deposit insurance and other guarantees, as well as, when needed, outright recapitalisation of failing institutions.25
This backstop role is visible in bank ratings. The fact that banks' all-in credit ratings are meaningfully above their stand-alone ratings highlights the importance of implicit government guarantees (Graph 14.A).26 The wider ratings gap for EMEs compared with AEs suggests that reliance on the creditworthiness of the sovereign – and the potential cost for the government – are particularly important for EME banking systems (Graph 14.B).
Indeed, partly because of the sovereign's backstop function, the fiscal costs (direct and indirect) of financial crises are typically huge, as measured by the change in public debt following a crisis. Historically, public debt has tended to jump in the aftermath of a banking crisis, in both AEs and EMEs (Graph 15). The fiscal cost was especially large in the case of the GFC, reaching a median rise in debt-to-GDP of about 40 percentage points in AEs. A significant portion of crisis costs typically reflect fiscal recapitalisation packages and other outright support for the banking sector, although the bulk represents indirect costs from the macroeconomic fallout and any discretionary fiscal responses.27
The two-way link between the sovereign and the financial sector gives rise to the risk of a costly feedback loop. Through it, deteriorations in the creditworthiness of the sovereign and the banks can reinforce each other – the proverbial doom loop of the sovereign-bank nexus.28 Such episodes have been more common in EMEs. But the sovereign debt crisis in the euro area has shown that AEs are not immune.29 Credit ratings show that the credit risk of sovereigns and banks are tightly connected in both EMEs and AEs (Graph 14.C). Similarly, spreads on CDS referencing sovereign assets and bank assets are typically tightly linked, indicating that bank and sovereign risks tend to move in tandem.30
Over the past decade, the rapid increase in sovereign debt has left investors and financial intermediaries increasingly exposed not only to sovereign credit risk, but also to interest rate risk.31 This is particularly the case, as governments increasingly issued longer-maturity debt during the low-yield era to lock in low financing costs (Graph 16.A). And even though large-scale asset purchases by some AE central banks reduced exposures by replacing sovereign debt with bank reserves in private sector portfolios, the average maturity of debt net of central bank purchases has still risen since pre-GFC (Graph 16.B). A hypothetical 300 basis point increase in government bond yields, for example, would result in estimated losses to bondholders (excluding the central bank) corresponding to between approximately 10 and 35% of GDP in major AEs, and up to 10% in major EMEs (Graph 16.C). Those losses would have been even larger had it not been for central banks' asset purchases, especially among AEs.
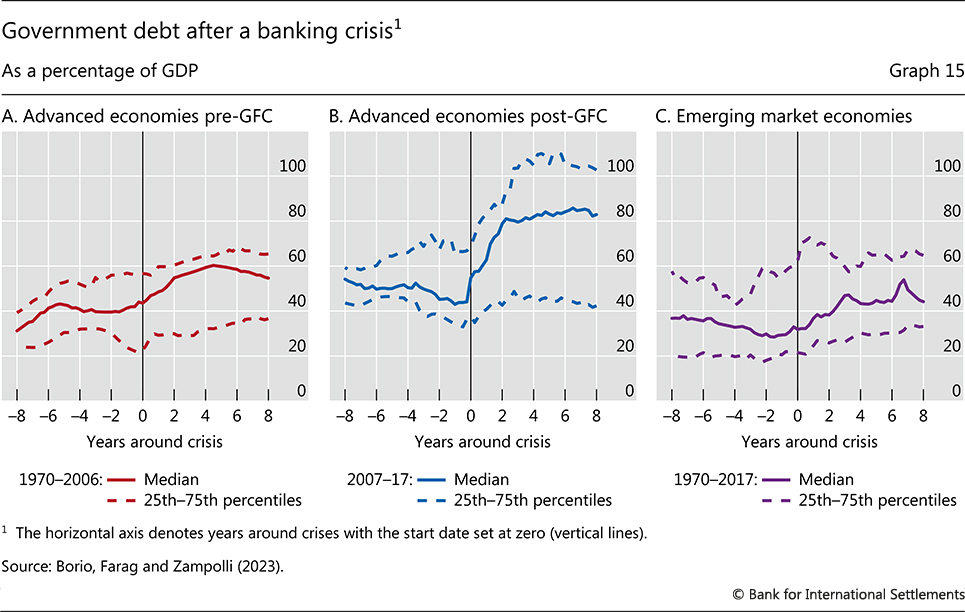
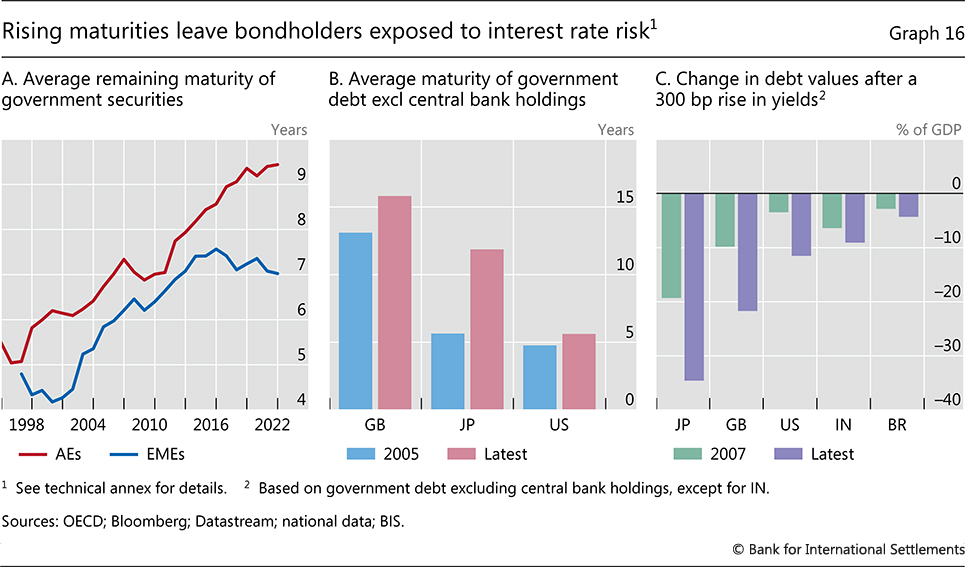
Within the financial sector, banks and NBFIs were the main investors in government securities. Banks across advanced and emerging market economies hold large quantities of sovereign bonds, in some cases multiple times their capital (Graph 17.A and 17.B). NBFIs have been playing an increasing role, following their rapid growth post-GFC. The sector, which holds close to half of total financial assets globally,32 on average accounts for approximately 40% of government bond holdings in AEs and 60% in EMEs.33 The tight interconnections between banks and NBFIs mean that distress can easily spread between the two sectors and intensify in the process (Graph 17.C).34
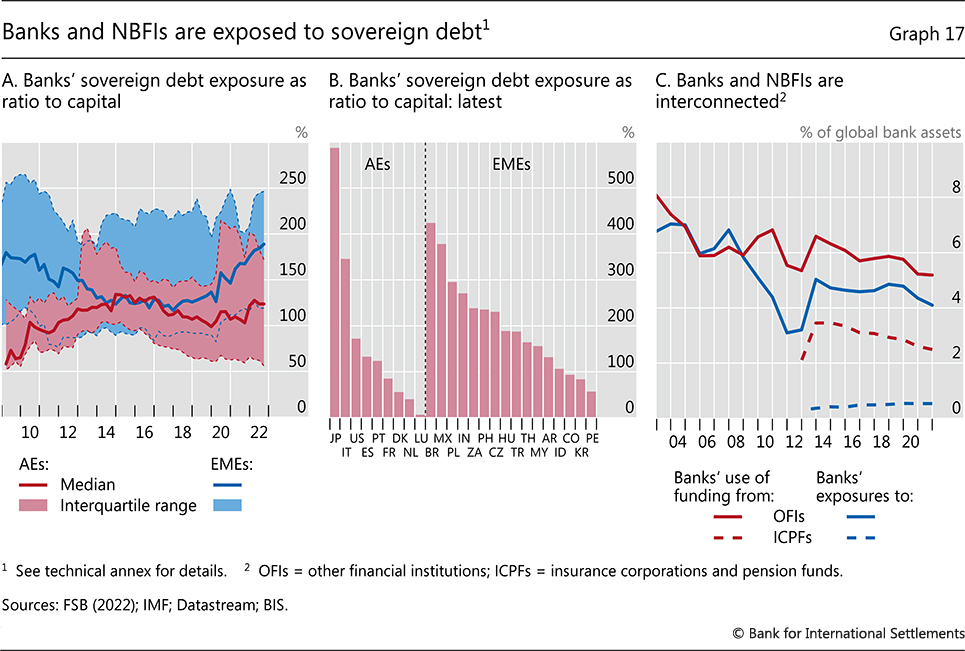
High sovereign debt heightens the risk to the financial system not just because of the sheer size of the exposures but, importantly, because it increases the likelihood of sharp bond yield moves. In particular, during monetary policy tightening phases, long-term yields have tended to rise more in high-debt countries than in low-debt countries, especially among EMEs (Graph 18.A). To a significant degree, this has been due to higher credit risk premia: sovereign CDS premia have tended to rise markedly for high-debt EMEs when monetary policy is tightened, but not for low-debt EMEs (Graph 18.B). While the effects of rate hikes on yields are smaller for AEs, this is based on a sample that includes a prolonged period of heavy government debt purchases by AE central banks. As these purchases end and begin to reverse, the situation may change.
The risk of sharp yield adjustments is higher when liquidity in bond markets is structurally poor. The Covid-19 crisis showed how quickly market functioning can break down when liquidity conditions in sovereign bond markets are fragile. In March 2020, one-sided selling pressure (the "dash for cash") – disorderly deleveraging by hedge funds and other players – interacted with intermediation bottlenecks to create a perfect storm that led to dysfunction even in markets that are typically among the most liquid ones in the world.35 The fact that, currently, indicators point to fragile liquidity conditions suggests that risks of market dysfunction should not be underestimated (Graph 18.C).
One factor that has amplified the impact of government debt on market dynamics under stress is its pervasive role as collateral (Box D). On the one hand, this allows greater build-up in leverage. On the other hand, it intensifies fire sales when the system is hit by shocks that induce agents to sell the paper. This can undermine the safe haven status of government bonds even when their credit quality is not in doubt.
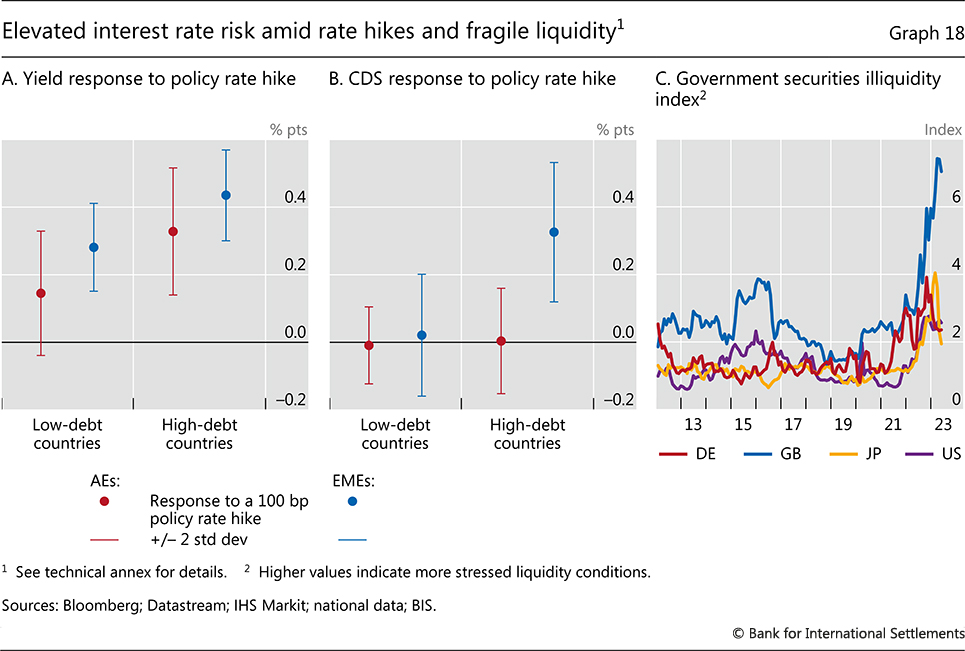
In the current hiking cycle, government debt exposures have already been a source of financial stress. So far, the problems have been linked to interest rate risk, not sovereign risk (Chapter I). They have reflected the accumulation of exposures during the long phase of unusually low interest rates. Losses on government bond holdings have been at the heart of recent stress in the banking system in the United States and of NBFIs in the United Kingdom. The stress has prompted broad-based central bank liquidity support and, in the case of the banks, the extension of deposit guarantees, which in turn increases the potential costs to public finances. Looking ahead, however, given prospective further deterioration in the creditworthiness of sovereigns, credit risk could also become, once again, a source of stress.
This analysis suggests that the financial sector is especially vulnerable following a prolonged period of lax fiscal policy and loose monetary policy. This is because the overall size of sovereign exposures is higher, the sensitivity of those exposures to adjustments in yields is greater and the likelihood of those adjustments is also greater. If investors perceive that the policy mix is reaching the boundaries of the region of stability, government bonds could reprice rapidly and forcefully. Yields would rise sharply as investors would require significantly higher compensation to be exposed to inflation risk or, especially in the case of EMEs, to sovereign credit risk. And sovereigns with lower creditworthiness would be particularly vulnerable. This, in turn, would compound risks among banks and other financial institutions.
Policy implications
The analysis of the journey to the boundaries of the region of stability and of the risks ahead raises both near- and longer-term challenges for monetary and fiscal policy.
In the near term, the challenge is to ensure a consistent policy mix that delivers a return to low inflation while tackling financial stability risks (Chapter I), thereby withdrawing from the boundaries of the region of stability. The priority for monetary policy is to restore price stability. Should a shift to a high-inflation regime take place and inflation become entrenched, it would be very costly to return to a regime of low and stable inflation.36 At the same time, monetary policy will have to alleviate financial strains to prevent systemic financial instability. There will be a premium on distinguishing, to the extent possible, the measures designed to achieve the two objectives. Regardless, it will be essential to ensure that the tightening path consistent with lower inflation is not compromised by the immediate needs of the financial sector. Fiscal policy plays an important complementary role. Through consolidation, it would help to reduce pressure on aggregate demand and inflation, limit the risk of being a source of financial instability and provide more headroom, should it be called upon, to support crisis management by tackling solvency concerns.
The longer-term challenge is to ensure that monetary and fiscal policies operate well within the region of stability on a lasting basis, heeding the lessons learnt along the journey. This has implications for strategies, institutions and mindsets.
To avoid testing the boundaries of the region of stability, policy strategies should aim to retain room for policy manoeuvre over time. In the journey to the boundaries over the past decades, these safety margins evaporated to a significant extent due to an asymmetric conduct of policy over the business cycle, with easing in the bust not compensated for by a commensurate tightening in the boom.
To retain greater monetary space, once price stability is re-established, monetary policy could be more tolerant of moderate, even if persistent, shortfalls of inflation from point targets. In a low-inflation regime, inflation has certain self-stabilising properties, so that there is less need to respond forcefully to correct deviations from target. Furthermore, the evidence indicates that monetary policy has less traction in lifting inflation under such conditions. Such a refinement in frameworks would also help limit the side effects that arise from prolonged periods of monetary accommodation. Foremost among such side effects is the build-up of financial vulnerabilities, which tend to further constrain both monetary and fiscal policy headroom when financial stress emerges.
Careful consideration should also be given to keeping central bank balance sheets as small and as riskless as possible, subject to delivering successfully on the mandate. This would have three benefits. First, it would limit the footprint of the central bank in the economy, thereby reducing the institution's involvement in resource allocation and the risk of inhibiting market functioning. Second, it would lessen the economic and political economy problems linked to transfers to the government. Finally, it would maximise the central bank's ability to expand the balance sheet when the need does arise. Given the costs of large and risky balance sheets, the initial size is a hindrance, not an advantage. The balance sheet needs to be elastic, not large.
As for fiscal policy, there is an urgent need to consolidate fiscal positions. Relying on inflation to reduce the government debt burden is obviously not an option. It would have only a temporary effect. And, in the longer run, it would generate the very instability that would seriously damage the economy and public finances in the process. Moreover, to support consolidation it would be useful to incorporate the role of financial factors more systematically. For instance, when assessing fiscal space, it would be important to account for the flattering effect of financial booms on fiscal accounts and the possible costs of financial stress. Greater reliance on automatic stabilisers more generally would also help.
Consolidation should go hand in hand with fiscal strategies that boost sustainable growth. For one, efforts could be made to reduce or eliminate the typical bias in tax systems that favours debt over equity. This has encouraged excessive reliance on debt as an engine of growth. In addition, the quality of public spending is crucial. For example, it would be important to rebalance government expenditures towards well chosen and effectively executed investment projects – especially in infrastructure and green energy – as well as human capital building (education and health). Such a rebalancing would correct a decade-long downward trend in public investment that made room for more inflexible spending components, such as entitlements. Quite apart from being an ultimate policy objective, higher growth would also deliver stronger public finances and at higher real interest rates – more in line with an efficient allocation of capital and resources.
Beyond adjustments to monetary and fiscal policy strategies, institutional safeguards are necessary to limit tensions between the two policies and promote their coherence. Central bank independence remains the key pillar to ensure that monetary policy can pursue its price stability mandate, especially in the current context of elevated public debt levels and stubbornly high inflation. On the fiscal side, stronger institutional safeguards would help encourage prudent fiscal policy. To this end, fiscal rules and fiscal councils could play an important role in setting guardrails, all the more so if backed by appropriate constitutional provisions.
But policy adjustments should not be limited to monetary and fiscal policy alone. Other policies can play a complementary role.
Prudential policy is critical, given how disruptive financial instability can be for the region of stability. Both its microprudential and macroprudential dimensions are important.
As regards microprudential regulation and supervision, a lot has been done following the GFC. That said, progress has been uneven. And recent strains in the banking sector indicate that there is still work to do, with respect to both regulatory standards and, equally importantly, supervisory practices (see Chapter I for an elaboration). Some of that work relates more specifically to the risks linked to sovereign exposures. For banks, the Basel III framework continues to apply a preferential regulatory treatment to those exposures, particularly with regard to credit/default, interest rate and liquidity risks for exposures valued at amortised cost and held in the banking book.37 Similarly, while efforts are under way to address NBFI vulnerabilities, these have so far been insufficient, including with regard to the NBFI-sovereign nexus. As such, more could be done to ensure that regulation better mitigates sovereign risk for both banks and NBFI entities and to avoid undue risk concentrations.38 Any such stricter prudential treatment would need to be calibrated and implemented in the light of the special role of sovereign debt in the financial system.
Macroprudential regulation is an important complement to its microprudential counterpart. Well calibrated, it can help deal with, and mitigate, the costs and intensity of domestic financial cycles.39 It can also help address the consequences of ebbs and flows of global financial conditions, supported by foreign exchange intervention and, in case of need, capital flow management measures.
The ultimate objective would be to set up a more holistic macro-financial stability framework. In such a framework, monetary, fiscal and prudential policy would operate in a coherent fashion to foster economic stability. This would considerably alleviate trade-offs and avoid overburdening individual policies. Post-GFC, major steps have been taken in that direction. That said, this is still very much a work in progress, analytically and practically.40 And the integration of fiscal policy has not proceeded as far as the others.
Sound structural policies boosting sustainable growth will be key to relieve monetary and fiscal policy from the pressures to act as engines of growth which pushed them beyond the boundaries of the region of stability. Achieving higher and sustainable growth can only be accomplished by boosting the productive potential of the economy through effective measures that enhance the supply side. Over the past decades there has been a worrying slowdown in global growth. The slowdown was driven, in particular, by a marked decline in the growth of total factor productivity (TFP), which measures the efficiency of use of labour and capital inputs. To revive TFP growth, therefore, it is essential to enhance the efficiency of production. This requires renewed efforts to design and implement structural reforms, which have slowed substantially since the early 2000s. Boosting competition in product markets, reducing red tape and facilitating a more efficient allocation of labour are key areas to provide new impetus for innovation and growth.
Ultimately, what is needed is a change in mindsets. Policymakers need to have a keener recognition of the limitations of macroeconomic stabilisation policies. Monetary and fiscal policy can be a major force for good, but, if overly ambitious, can also cause great damage. The journey described in this chapter shows that, if the specific challenges evolve with the economic landscape, the root cause of failures does not. The fallacies of the "growth illusion" highlight that stabilisation policies cannot be engines of lasting economic growth.41 The concept of the region of stability, hard as it may be to apply in real time, can promote the necessary shift in perspective. This is because the concept embodies the recognition of the limitations of macroeconomic policies. The region is first and foremost not a precise set of numbers, but a lens through which to look at the world and to guide policy. It can help preserve the all-important trust that society must have in the state and its decision-making.
Endnotes
1 See Carstens (2023).
2 See Carstens (2022).
3 The concept of a region or corridor of stability was coined by Leijonhufvud (2009) in the early 1970s to indicate how the economy can become unstable if it is operating outside a particular range. Borio and Disyatat (2021) have underscored how this region places constraints on the room for manoeuvre for fiscal and monetary policy while in turn being affected by the cumulative fiscal and monetary stance over time.
4 See Padoa-Schioppa and Saccomanni (1994).
5 See Aikman et al (2022).
6 For empirical estimates of the flattering effects of financial booms on fiscal balances, see Borio et al (2017).
7 See BIS (2022a) for a detailed analysis.
8 See Ahmed et al (2021). In addition, changes in the policy stance appear to have a smaller effect on inflation in low-inflation regimes. This is because, as one might expect, monetary policy has a larger impact on the common component of price changes – a measure closer to the concept of "true" inflation – than on relative price changes, see BIS (2022a) and Borio, Lombardi, Yetman and Zakrajšek (2023).
9 This effect is reinforced by larger effects of a given change in the monetary policy stance on asset prices and credit over time, see BIS (2015) and Hofmann and Peersman (2017).
10 For evidence on the negative link between fiscal multipliers and the level of public debt, see Ilzetzki et al (2013) and Banerjee and Zampolli (2019).
11 For a discussion of the roots of inflation in Latin America, see Bernanke (2005). Kehoe and Nicolini (2021) provide a detailed account of the monetary and fiscal interactions in Latin American countries since the 1960s.
12 See BIS (2019, 2022b) and CGFS (2019).
13 For instance, as a result of a history of inflation and default, the safe level of external debt can be very low for many EMEs due to the "debt intolerance" of investors (Reinhart et al (2003)).
14 As highlighted by Calvo and Reinhart (2002), there is often a discrepancy between de jure and de facto exchange rate regimes. In particular, many EMEs have flexible exchange rate regimes officially, but in practice pursue managed exchange rate arrangements limiting exchange rate swings and reflecting the vulnerability to such swings.
15 See BIS (2019, 2020, 2021, 2022b) for analyses of the enduring challenges of capital flow and exchange rate fluctuations for policy frameworks in EMEs.
16 For a discussion of the features of EME macro-financial stability frameworks, see BIS (2019, 2022b).
17 Empirical analyses examining the historical relationship between real interest rates and the standard set of saving-investment drivers find – without imposing strong theoretical priors – little evidence of a systematic link; see eg Borio et al (2017) and references therein.
18 See IMF (2023).
19 These facts are documented in Lian et al (2020) based on a large panel of advanced and emerging market economies since 1950. See also Mauro and Zhou (2021) for evidence that negative differentials between interest rates and growth rates are not systematically associated historically with a lower risk of government default.
20 The classification of fiscal regimes as prudent or profligate follows Mauro et al (2015).
21 See Banerjee et al (2023).
22 The classical statement of fiscal dominance goes back to Sargent and Wallace (1981).
23 Grigoli and Sandri (2023) examine the sensitivity of household inflation expectations to public debt levels using information provision experiments in surveys conducted in Brazil, the United Kingdom and the United States.
24 Sovereign loss-given-default rates have averaged 37% based on a sample of 180 defaults in 68 countries over the period 1970 to 2010; see Cruces and Trebesch (2013).
25 Moreover, to the extent that the sovereign supports the broad economy, it reduces defaults and unemployment, and hence supports the financial system.
26 Stand-alone ratings reflect the intrinsic financial strength of banks, ie the likelihood of default provided that no external support is forthcoming. All-in ratings take into account the likelihood and magnitude of extraordinary external support, in particular from the government, that banks may receive when in distress. See Packer and Tarashev (2011) for a discussion.
27 For banking crises in AEs, the direct fiscal costs related to financial sector support corresponded, on average, to approximately a third of the total increase in public debt following the crisis. Taking into account any subsequent recoveries, the ratio was around one fifth. See Laeven and Valencia (2013, 2018) for details.
28 See eg Farhi and Tirole (2018) and Borio, Farag and Zampolli (2023).
29 See eg Li and Zinna (2018).
30 See the discussion in Borio, Farag and Zampolli (2023) and references therein. Dieckmann and Plank (2012) analyse the sovereign CDS market in AEs and find evidence of a private-to-public risk transfer through expectations of government bailouts.
31 See eg English et al (2018).
32 See FSB (2022).
33 The figure for AEs excludes the United States, where NBFIs hold around 60% of government bonds, and the figure for EMEs excludes China, for which the share is about 40%. See Fang et al (2022).
34 See also BCBS (2022).
35 See Schrimpf et al (2020), Eren and Wooldridge (2021) and FSB (2022).
36 See BIS (2022a) and Borio, Lombardi, Yetman and Zakrajšek (2023).
37 See BCBS (2017).
38 See Borio, Farag and Zampolli (2023).
39 See BIS (2018).
40 See BIS (2022b).
41 See Carstens (2022).
Technical annex
Graph 1: Statistics are computed using a smaller set of countries when data are not available.
Graph 1.A: The sample covers AR, AU, BE, BR, CA, CH, CL, CN, DE, ES, FI, FR, GB, HK, ID, IE, IN, IT, JP, KR, MX, MY, NL, NO, PE, PH, SE, SG, TH and US.
Graph 1.B: General (if not available, central) government core (if not available, total) debt at nominal (if not available, market) value. The sample covers AR, AT, AU, BE, BR, CA, CH, CL, DE, DK, ES, FR, GB, GR, IN, IT, JP, NL, NO, NZ, PT, RU, SE and US.
Graph 2.A: Inflation measured as year-on-year growth rate; mean across countries in sample: AR, BO, BR, MX, PE, UY and VE. Central bank claims on government is the sum of claims on central, state and local government, and public non-financial companies.
Graph 3: Business cycle dates are from National Bureau of Economic Research for US; Economic Cycle Research Institute for AU, CA, CH, DE, ES, FR, GB, IT, JP and SE. For BE, FI, IE, NL and NO business cycles are dated with a business cycle-dating algorithm. Episodes for which data for the previous and next 20 quarters are available are used in computing the medians.
Graph 4.A: Impulse response of real GDP to a 100 bp expansionary monetary policy shock. The threshold for the low rate regime is 2.25%, chosen to maximise empirical fit using a grid-search procedure. See Ahmed et al (2021).
Graph 4.B: From 25-year moving window mean-group panel estimation of fiscal reaction functions. The sample covers: AT, AU, BE, CA, CH, DE, DK, ES, FI, FR, GB, GR, IE, IT, JP, NL, NO, NZ, PT, SE and US. The empirical fiscal reaction function takes a standard form, modelling the primary deficit as a function of the lagged public debt-to-GDP ratio, the output gap and the interest rate paid on the outstanding debt. See Cheng et al (2023).
Graph 5.A: General government gross debt held by domestic central bank. The sample covers AT, AU, BE, CA, CH, DE, DK, ES, FI, FR, GB, GR, IE, IT, JP, NL, NO, NZ, PT, SE and US.
Graph 5.B: Central bank holdings of bonds issued by the central government except the ECB (debt securities issued by the general government).
Graph 6: Median across AEs = AU, BE, CA, CH, DE, ES, FI, FR, GB, IE, IT, JP, NL, NO, SE and US. EMEs = AR, BR, CL, CN, CO, HK, ID, IN, KR, MX, MY, PE, PH, SG, TH and VN. For fiscal balance and public debt, IMF forecasts for 2023.
Graph 7: Median annual inflation across countries within each region, simple average of medians for each period. For crises, data for AE, MT and SA are not available; latest is 2017.
Graph 8.A: The sample covers AE, AR, BR, CL, CN, CO, CZ, DZ, HK, HU, ID, IL, IN, KR, KW, MA, MX, MY, PE, PH, PL, RO, RU, SA, SG, TH, TR and ZA.
Graph 8.C: Cumulative sum of the average number of measures per country. No data available for CY, DZ, JP, KW, MA and MT.
Graph 9.A: Average sovereign debt ratings from Fitch, Moody's and S&P. The series plotted represent cross-country medians, for a smaller sample when data are not available. AEs = AT, AU, BE, CA, CH, CY, DE, DK, EE, ES, FI, FR, GB, GR, HR, IE, IT, JP, LT, LU, LV, MT, NL, NO, NZ, PT, SE, SI, SK and US. EMEs = BR, CL, CN, CO, CZ, HK, HU, ID, IL, IN, KR, MA, MX, MY, PE, PH, PL, RO, SG, TH, TR, VN and ZA.
Graph 9.B: Change in general government debt as a percentage of GDP between year t and t+5 and over inflation in year t, excluding periods when a debt restructuring took place. The sample includes annual data between 1970 and 2022 for AE, AR, AT, AU, BE, BR, CA, CH, CL, CN, CO, CZ, DE, DK, DZ, ES, FI, FR, GB, GR, HK, HU, ID, IE, IL, IN, IT, JP, KR, MA, MX, MY, NL, NO, NZ, PE, PH, PL, PT, RO, RU, SA, SE, SG, TH, TR, US and ZA. The fitted line is obtained by regressing changes in the debt-to-GDP ratio over inflation and country fixed effects. The sample is restricted to annual inflation rates below 100%. If episodes with inflation above 100% are included, there is no statistically significant relation between changes in debt and inflation.
Graph 10: Baseline projections assume an interest rate-growth differential equal to –1% and constant primary deficits in percent of GDP as of 2022. Age-related spending are based on IMF projections for pension and healthcare spending for 2030 and 2050. For the additional spending increase scenario it is assumed that the primary deficit will increase by 2% of GDP by 2030 and stay at that level afterwards. Historical debt is computed using a smaller set of countries when data are not available. Simple average across AEs = AT, BE, DE, ES, FI, FR, GB, IE, IT, JP, NL, PT and US. EMEs = AR, BR, CL, CN, CO, CZ, HU, ID, IL, IN, KR, MX, PL and ZA.
Graph 11.A: The sample covers AT, AU, BE, CA, CH, DE, DK, EE, ES, FI, FR, GB, GR, IE, IT, JP, LT, LU, LV, NL, NO, NZ, PT, SE, SI, SK and US. For 2022, data not available for GB, JP, NL, PT, SI and SK.
Graph 11.B: The sample covers AR, AT, AU, BE, BR, CA, CH, CL, DE, DK, ES, FR, GB, GR, IN, IT, JP, NL, NO, NZ, PT, RU, SE and US. Statistics are computed using a smaller set of countries when data are not available. Government debt-to-GDP multiplied by the simple average of short-term and long-term interest rates, where government debt is general (if not available, central) government core (if not available, total) debt at nominal (if not available, market) value. The counterfactual median debt service cost is constructed using the interest rate levels prevailing in 1995.
Graph 12.A: Based on Banerjee et al (2022). The sample covers AT, AU, BE, CA, CH, DE, DK, ES, FI, FR, GB, GR, IE, IT, JP, NL, NO, NZ, PT, SE and US. Fiscal regimes are classified as prudent or profligate based on Mauro et al (2015). Monetary policy independence is defined as being high or low based on legal limitations on central bank lending to the public sector in Romelli (2022). Estimation sample from 1972–2011 upon data availability.
Graph 12.B: Based on Banerjee et al (2023). Coefficient intervals at 90% confidence bands clustered by country. The sample covers AEs = AT, AU, BE, CA, CH, DE, DK, ES, FI, FR, GB, GR, IE, IT, JP, NL, NO, NZ, PT, SE and US. EMDEs = BO, BR, CL, CN, CO, DO, GH, HK, HN, HT, HU, ID, IL, IN, KR, MX, NI, PE, PH, PL, RO, RU, TH, TR, UY and ZA. The period covered is 1972–2011 upon data availability.
Graph 13.A: Coefficients are six-year rolling window long-run multipliers from the equation:

The sample starts in Q1 1995. For details, see Jašová et al (2019). The ranges indicate the 90% confidence intervals. AEs = AU, CA, GB, NO, NZ and SE. EMEs = BR, CL, CN, CO, CZ, HK, HU, ID, IL, IN, KR, MX, MY, PE, PH, PL, RO, RU, SG, TH and ZA.
Graph 13.B–C: Estimates following Aguilar et al (2023) based on a sample for BR, CL, CN, CO, CZ, HK, HU, ID, IL, IN, KR, MX, MY, PE, PH, PL, RO, RU, TH, TR and ZA from Q1 2000 to Q1 2023.
Graph 14.A–B: Mean credit ratings across AEs = AU, BE, CA, DE, ES, FI, FR, GB, GR, HR, IE, IT, JP, NL, NO, NZ, PT, SE, SI, SK and US. EMEs = AE, CL, CN, CO, CZ, HK, ID, IL, IN, KR, MT, MX, MY, PH, PL, RO, RU, SA, TH, TR, TW and ZA. For stand-alone, Fitch Viability; for all-in, Fitch LT Issuer Default Rating.
Graph 14.C: Mean bank credit ratings by jurisdiction. For sovereign, S&P Local Currency Long-term Debt Rating; for bank, S&P Local Currency Long-term Issuer Rating. AEs = AU, CA, CH, DE, DK, ES, FR, IT, JP, NO, SE and US; EMEs = AR, BR, CL, CN, CO, CZ, HK, HU, ID, IL, IN, KR, MX, MY, PE, PH, PL, RU, SA, SG, TH, TR and ZA.
Graph 16.A: Simple average maturity of central government debt securities issued across countries in the region upon data availability. AEs = AT, AU, BE, CA, DE, ES, FR, GB, GR, IT, JP, NL and US. EMEs = AR, BR, CL, CO, CZ, HK, HU, ID, IN, KR, MX, MY, PE, PH, PL, SA, SG, TH, TR and ZA.
Graph 16.B: Refers to average remaining maturity. For US, average length of marketable interest-bearing public debt securities held by private investors. For GB and JP, estimated based on outstanding amounts and average maturities excluding holdings of the domestic central bank.
Graph 16.C: For each country, estimated change in the value of outstanding government debt as a percentage of GDP (latest value) following a hypothetical 3 percentage point increase in yields across the term structure. For IN, figures based on total debt securities. For BR, based on domestic federal debt held by the public. For GB, JP and US, based on figures from panel B. For IN, 2007 figures correspond to Q1 2011.
Graph 17.A–B: The sample consists of AEs = AT, DK, ES, FR, IT, JP, LU, NL, PT and US. EMEs = AR, BR, CL, CO, CZ, HU, ID, IN, KR, MX, MY, PE, PH, PL, SG, TH, TR and ZA, where data are available. Other depository corporations net claims on central government and their claims on state and local government by residence, as percentage of banks' Tier 1 capital. The reporting depository corporations comprise all solo entities resident in the country, including those which are foreign-owned subsidiaries or branches of foreign entities. Branches and subsidiaries abroad of domestically owned entities are not included. Latest corresponds to latest available quarterly figure in 2022. For AT, data up to Q3 2021; for CL, data up to Q4 2021; for SG, data up to Q4 2019.
Graph 17.C: Sample covers: AR, AU, BR, CA, CH, CL, CN, EA, GB, HK ID, IN, JP, KR, KY, MX, RU, SA, SG, TR and US (RU until 2020). Changes in interconnectedness measures may also reflect improvements in the availability of data over time at a jurisdictional level. Banks' use of funding from OFIs is banks' liabilities to OFIs as a share of bank assets. Banks' exposure to OFIs means banks' claims on OFIs as a share of bank assets.
Graph 18.A–B: Coefficients from a linear regression of quarterly changes of 10-year sovereign bond yields and five-year sovereign CDS spreads on a constant and the policy rate change, conditional on the policy rate being raised. Dots correspond to point estimates and bars to +/– two standard deviations. Low- and high-debt countries correspond to the lowest and highest quartile of the distribution of government debt to GDP. Sample covers AEs = AU, BE, CA, CH, DE, DK, ES, FR, GB, IT, JP, NL, NO, NZ, SE and US. EMEs = AR, BR, CL, CN, CO, CZ, HK, HU, ID, IL, IN, KR, MX, MY, PL, SG, TH, TR and ZA (with varying availability of individual variables).
Graph 18.C: The index displays the average deviation of yields across government securities relative to a fair-value yield curve model. Monthly average of daily data.
References
Abbas, S, N Belhocine, A El-Ganainy and M Horton (2010): "A historical public debt database", IMF Working Papers, no 245.
Aghion, P, P Bacchetta and A Banerjee (2004): "A corporate balance-sheet approach to currency crises", Journal of Economic Theory, vol 119, no 1, pp 6–30.
Aguilar, A, C Cantú and R Guerra (2023): "Fiscal and monetary policy in emerging market economies: what are the risks and policy trade-offs?", BIS Bulletin, no 71, March.
Ahmed, R, C Borio, P Disyatat and B Hofmann (2021): "Losing traction? The real effects of monetary policy when interest rates are low", BIS Working Papers, no 983.
Aikman, D, M Drehmann, M Juselius and X Xing (2022): "The scarring effects of deep contractions", BIS Working Papers, no 1043.
Aramonte, S, A Schrimpf and H S Shin (2022): "Non-bank financial intermediaries and financial stability", BIS Working Papers, no 972.
Aramonte, S and P Rungcharoenkitkul (2022): "Leverage and liquidity backstops: cues from pension funds and gilt market disruptions", Box B, BIS Quarterly Review, December, pp 7–8.
Arslanalp, S and T Tsuda (2014): "Tracking global demand for advanced economy sovereign debt", IMF Economic Review, vol 62, no 3, (dataset updated January 2023).
Banerjee, R, V Boctor, A Mehrotra and F Zampolli (2022): "Fiscal deficits and inflation risks: the role of fiscal and monetary regimes", BIS Working Papers, no 1028, July.
--- (2023): "Fiscal sources of inflation risk in EMDEs: the role of the external channel", forthcoming.
Banerjee, R and F Zampolli (2019): "What drives the short-run costs of fiscal consolidation? Evidence from OECD countries", Economic Modelling, vol 82, pp 420–36.
Bank for International Settlements (BIS) (2015): "Another year of monetary policy accommodation", 85th Annual Report, June, Chapter IV, Box IV.B.
--- (2018): "Moving forward with macroprudential frameworks", Annual Economic Report 2018, June, Chapter IV.
--- (2019): "Monetary policy frameworks in EMEs: inflation targeting, the exchange rate and financial stability", Annual Economic Report 2019, June, Chapter II.
--- (2020): "Capital flows, exchange rates and policy frameworks in emerging Asia", report by a Working Group established by the Asian Consultative Council of the Bank for International Settlements, November.
--- (2021): "Capital flows, exchange rates and monetary policy frameworks in Latin American and other economies", report by seven members of the BIS CCA central banks and the Central Banks of South Africa and Turkey, April.
--- (2022a): "Inflation: a look under the hood", Annual Economic Report 2022, June, Chapter II.
---(2022b): "Macro-financial stability frameworks and external financial conditions", report submitted to the G20 finance ministers and central bank governors, July.
Basel Committee on Banking Supervision (BCBS) (2013): Basel III: The Liquidity Coverage Ratio and liquidity risk monitoring tools, January.
--- (2017): The regulatory treatment of sovereign exposures, December.
--- (2020): Calculation of RWA for credit risk. Standardised approach: credit risk mitigation, November.
--- (2022): Newsletter on bank exposures to non-bank financial intermediaries, November.
BCBS-International Organization of Securities Commissions (IOSCO) (2020): Margin requirements for non-centrally cleared derivatives, April.
Bergant, K, F Grigoli, N Hansen and D Sandri (2023): "Dampening global financial shocks: can macroprudential regulation help (more than capital controls)?", BIS Working Papers, no 1097.
Bernanke, B (2005): "Inflation in Latin America – a new era?", remarks at the Stanford Institute for Economic Policy Research Economic Summit, Stanford, California, 11 February.
Bianchi, J and G Lorenzoni (2022): "The prudential use of capital controls and foreign currency reserves", in G Gopinath, E Helpman and K Rogoff (eds), Handbook of international economics, vol 6, North-Holland.
Blanchard, O (2019): "Public debt and low interest rates", American Economic Review, vol 109, no 4, pp 1197–229.
--- (2022): Fiscal policy under low interest rates, MIT Press.
Borio, C and P Disyatat (2021): "Monetary and fiscal policy: privileged powers, entwined responsibilities", SUERF Policy Note, no 238.
Borio, C, P Disyatat and P Rungcharoenkitkul (2019): "What anchors for the natural rate of interest?", BIS Working Papers, no 777, March.
Borio, C, P Disyatat, M Juselius and P Rungcharoenkitkul (2017): "Why so low for so long? A long-term view of real interest rates", BIS Working Papers, no 685, December.
Borio, C, M Farag and F Zampolli (2023): "Tackling the fiscal policy-financial stability nexus", BIS Working Papers, no 1090, April.
Borio, C, M Lombardi, J Yetman and E Zakrajšek (2023): "The two-regime view of inflation", BIS Papers, no 133, March.
Borio, C, M Lombardi and F Zampolli (2017): "Fiscal sustainability and the financial cycle", in L Odor (ed), Rethinking fiscal policy after the crisis, Cambridge University Press.
Borio, C and P Lowe (2002): "Asset prices, financial and monetary stability: exploring the nexus", BIS Working Papers, no 114.
Borio, C and R McCauley (1996): "The economics of recent bond market volatility", BIS Economic Papers, no 45, July.
Brunnermeier, M (2015): "Financial dominance", Twelfth Paolo Baffi Lecture, Bank of Italy.
Budnik, K and J Kleibl (2018): "Macroprudential regulation in the European Union in 1995–2014: introducing a new data set on policy actions of a macroprudential nature", ECB Working Papers, no 2123, January.
Calvo, G and C Reinhart (2002): "Fear of floating", The Quarterly Journal of Economics, vol 117, no 2, pp 379–408.
Carstens, A (2022): "A story of tailwinds and headwinds: aggregate supply and macroeconomic stabilisation", speech at the Jackson Hole Economic Symposium, 26 August.
--- (2023): "Monetary and fiscal policies as anchors of trust and stability", speech at Columbia University, New York, 17 April.
Cavallino, P and D Sandri (2023): "The open-economic ELB: contractionary monetary easing and the trilemma", Journal of International Economics, vol 140, January.
Cerutti, E, S Claessens and L Laeven (2017): "The use and effectiveness of macroprudential policies", Journal of Financial Stability, vol 28(C), pp 203–24.
Cheng, G, A Cornevin and B Hofmann (2023): "Other days, other ways? Fiscal and monetary policy reaction functions over the past seven decades", BIS, mimeo.
Cochrane, J (2023): The fiscal theory of the price level, Princeton University Press.
Committee on the Global Financial System (CGFS) (1999): "Recommendations for the design of liquid markets", CGFS Papers, no 13, September.
--- (2019): "Establishing viable capital markets", CGFS Papers, no 63, January.
Cruces, J and C Trebesch (2013): "Sovereign defaults: the price of haircuts", American Economic Journal: Macroeconomics, vol 5, no 3, pp 85–117.
Dieckmann, S and T Plank (2012): "Default risk of advanced economies: an empirical analysis of credit default swaps during the financial crisis", Review of Finance, vol 16, no 4, pp 903–34.
Eichengreen, B and U Panizza (2016): "A surplus of ambition: can Europe rely on large primary surpluses to solve its debt problem?", Economic Policy, vol 31, pp 5–49.
English, W, S Van den Heuvel and E Zakrajšek (2018): "Interest rate risk and bank equity valuations", Journal of Monetary Economics, vol 98, pp 80–97.
Eren, E and P Wooldridge (2021): "Non-bank financial institutions and the functioning of government bond markets", BIS Papers, no 119.
Fang, X, B Hardy and K Lewis (2022), "Who holds sovereign debt and why it matters", NBER Working Papers, no 30087, May.
Farhi, E and J Tirole (2018): "Deadly embrace: sovereign and financial balance sheets doom loops", Review of Economic Studies, vol 85, no 3, pp 1781–823.
Farhi, E and I Werning (2016): "A theory of macroprudential policies in the presence of nominal rigidities", Econometrica, vol 84, no 5, pp 1645–704.
Financial Stability Board (FSB) (2017): Review of OTC derivatives market reforms: effectiveness and broader effects of the reforms, June.
--- (2022): Global monitoring report on non-bank financial intermediation 2022, December.
Fischer, S, R Sahay and C Végh (2002): "Modern hyper- and high inflations", Journal of Economic Literature, vol 40, no 3, pp 837–80.
Grigoli, F and D Sandri (2023): "Public debt and household inflation expectations", BIS Working Papers, no 1082, March.
Hofmann, B and G Peersman (2017): "Monetary policy transmission and trade-offs in the United States: old and new", BIS Working Papers, no 649.
Ilzetzki, E, E Mendoza and C Végh (2013): "How big (small?) are fiscal multipliers?", Journal of Monetary Economics, vol 60, no 2, pp 239–554, March.
International Monetary Fund (IMF) (2018): "How to calibrate fiscal rules: a primer", IMF How to Notes, no 2.
--- (2023): "World Economic Outlook", April, Chapter 1.
Jašová, M, R Moessner and E Takáts (2019): "Exchange rate pass-through: what has changed since the crisis?", International Journal of Central Banking, vol 15, no 3, pp 27–58.
Jordà, Ò, M Schularick and A Taylor (2016): "Macrofinancial history and the new business cycle facts", in M Eichenbaum and J Parker (eds), NBER Macroeconomics Annual, vol 31, University of Chicago Press.
Kashyap, A and J Stein (2023): "Monetary policy when the central bank shapes financial-market sentiment", Journal of Economic Perspectives, vol 37, no 1, pp 53–76.
Kehoe, T and J Nicolini (2021): A monetary and fiscal history of Latin America, 1960–2017, University of Minnesota Press.
Korinek, A and A Simsek (2016): "Liquidity trap and excessive leverage", American Economic Review, vol 106, no 3.
Krugman, P (1979): "A model of balance-of-payment crises", Journal of Money, Credit and Banking, vol 11, no 3, pp 311–25.
Laeven, L and F Valencia (2013): "Systemic banking crises database", IMF Economic Review, vol 61.
--- (2018): "Systemic banking crises revisited", IMF Working Papers, no 206.
--- (2020): "Systemic banking crises database: a timely update in Covid-19 times", CEPR Discussion Papers, no 14569, April.
Leijonhufvud, A (2009): "Stabilities and instabilities in the macroeconomy", VoxEU, 21 November.
Li, J and G Zinna (2018): "How much of bank credit risk is sovereign risk? Evidence from Europe", Journal of Money, Credit and Banking, vol 50, no 6, pp 1225–69.
Lian, W, A Presbitero and U Wiriadinata (2020): "Public debt and r – g at risk", IMF Working Papers, no 137.
Mauro, P, R Romeu, A Binder and A Zaman (2015): "A modern history of fiscal prudence and profligacy", Journal of Monetary Economics, vol 76, pp 55–70.
Mauro, P and X Zhou (2021): "r – g < 0: can we sleep more soundly?", IMF Economic Review, vol 69, pp 197–229.
Mian, A, L Straub and A Sufi (2021): "Indebted demand", Quarterly Journal of Economics, vol 136, no 4, pp 2243–307.
--- (2022): "A goldilocks theory of fiscal deficits", NBER Working Papers, no 29707.
Obstfeld, M (1996): "Models of currency crises with self-fulfilling features", European Economic Review, vol 40, nos 3–5, pp 1037–47.
Packer, F and N Tarashev (2011): "Rating methodologies for banks", BIS Quarterly Review, June, pp 39–52.
Padoa-Schioppa, T and F Saccomanni (1994): "Managing a market-led global financial system", in P Kenen (ed), Managing the global economy: fifty years after Bretton Woods, Institute of International Finance, pp 235–68.
Reinhardt, D and R Sowerbutts (2016): "Macroprudential policies: a granular database", Bank of England Working Papers, no 632, December.
Reinhart, C, K Rogoff and M Savastano (2003): "Debt intolerance", Brookings Papers on Economic Activity, no 1.
Reis, R (2021): "The constraint on public debt when r < g but g < m", BIS Working Papers, no 939, May.
Romelli, D (2022): "The political economy of reforms in central bank design: evidence from a new dataset", Economic Policy, vol 37, no 112, pp 641–88.
Rungcharoenkitkul, P, C Borio and P Disyatat (2019): "Monetary policy hysteresis and the financial cycle", BIS Working Papers, no 817.
Sargent, T and N Wallace (1981): "Some unpleasant monetarist arithmetic", Federal Reserve Bank of Minneapolis Quarterly Review, vol 5, no 3, pp 1–17.
Schrimpf, A, H S Shin and V Sushko (2020): "Leverage and margin spirals in fixed income markets during the Covid-19 crisis", BIS Bulletin, no 2, April.
Schularick, M and A Taylor (2012): "Credit booms gone bust: monetary policy, leverage cycles, and financial crises, 1870–2008", American Economic Review, vol 102, no 2, pp 1029–61.
Shim, I, B Bogdanova, J Shek and A Subelyte (2013): "Database for policy actions on housing markets", BIS Quarterly Review, September, pp 83–95.
https://www.bis.org/publ/arpdf/ar2023e2.pdf
https://www.bis.org/publ/arpdf/ar2023e2.htm
https://www.youtube.com/watch?v=qvqzNMhPebo