Inflation and unconventional fiscal policy
Inflation surged around the world in 2022 and became a major policy problem. This column examines what caused the rise in inflation in the euro area and the US and how effective energy price measures in Europe were in helping to smooth it. The initial rise in inflation on both sides of the Atlantic in 2021 was driven by headline shocks, but since mid-2022, headline shocks comprise a larger share of inflation in the euro area than in the US. The headline shocks largely reflect increases in energy prices. Estimates suggest that energy price measures reduced euro area inflation by about 2 percentage points in 2022.
Inflation surged around the world in 2022 and became a major policy problem. It triggered numerous studies on the drivers of inflation (e.g. Cerrato and Gitt 2023) and on the effectiveness of policy responses. In this column, we aim to shed light on both issues, focusing on the euro area and the US, and on the role that unconventional fiscal policies – including energy price subsidies and tax cuts – can play in reducing inflation, drawing on our recent research (Dao et al. 2023).
We decompose headline inflation into core (underlying) inflation and deviations of headline from core. We seek to explain core inflation by long-term inflation expectations and the level of tightness in the labour market, and to explain the non-core component of headline inflation by price changes in energy and other industries. We also study the pass-through over time from these relative price shocks to core inflation, which can occur through the effects on wages and other costs of production. Our primary measure of core is weighted median inflation, which strips out the effects of unusually large price changes in certain industries. 1
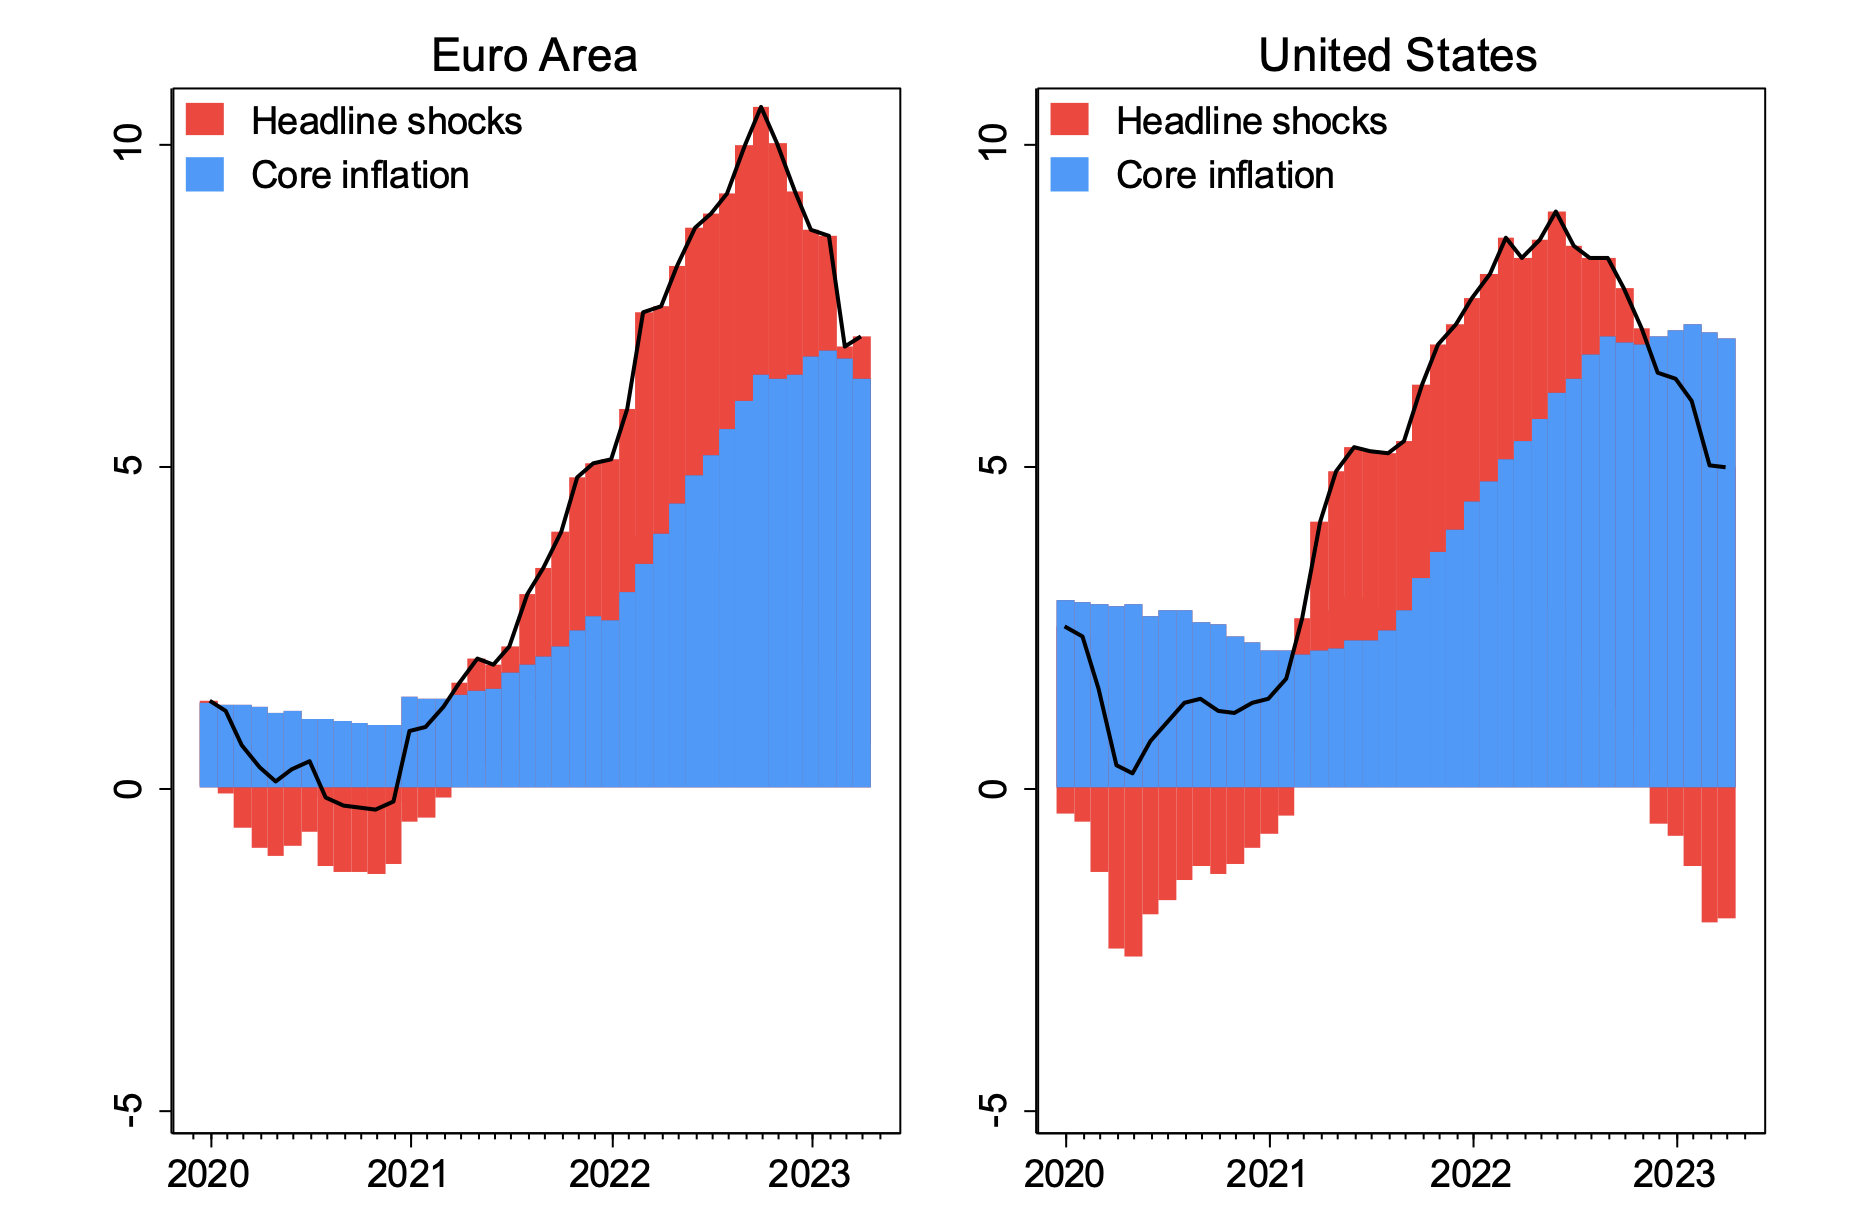
Figure 1 shows that on both sides of the Atlantic, the initial rise in inflation in 2021 was driven by headline shocks. But since mid-2022, headline shocks comprise a larger share of inflation in the euro area than in the US. We also find that energy price inflation has played a more dominant role in driving headline inflation shocks in the euro area than in the US.
Figure 1 Headline inflation, core, and headline-inflation shocks, 2020-2023 (%)

Note: Headline inflation is HICP for euro area and CPI for US. Core inflation is median weighted inflation computed by IMF staff for euro area and obtained from Federal Reserve Bank of Cleveland for US. Headline-inflation shocks denote deviations of headline inflation from core inflation.
Explaining the rise in euro area and US inflation
To understand the evolution of core inflation in the euro area and compare it with that of the US, we use a Phillips curve framework that focuses on the role of three variables: expected inflation, labour market tightness, and headline-inflation shocks. We allow for nonlinearities in the effects of labour market tightness and of past headline-inflation shocks on core. In our baseline specification for the euro area, we measure labour market tightness based on deviations of unemployment from the natural rate of unemployment. We compare these estimates with those obtained for the US based on the same specification with one difference: we measure US labour market tightness based on the ratio of job vacancies to unemployed to account for the observed shift in the US Beveridge curve (e.g. Blanchard and Bernanke 2023).
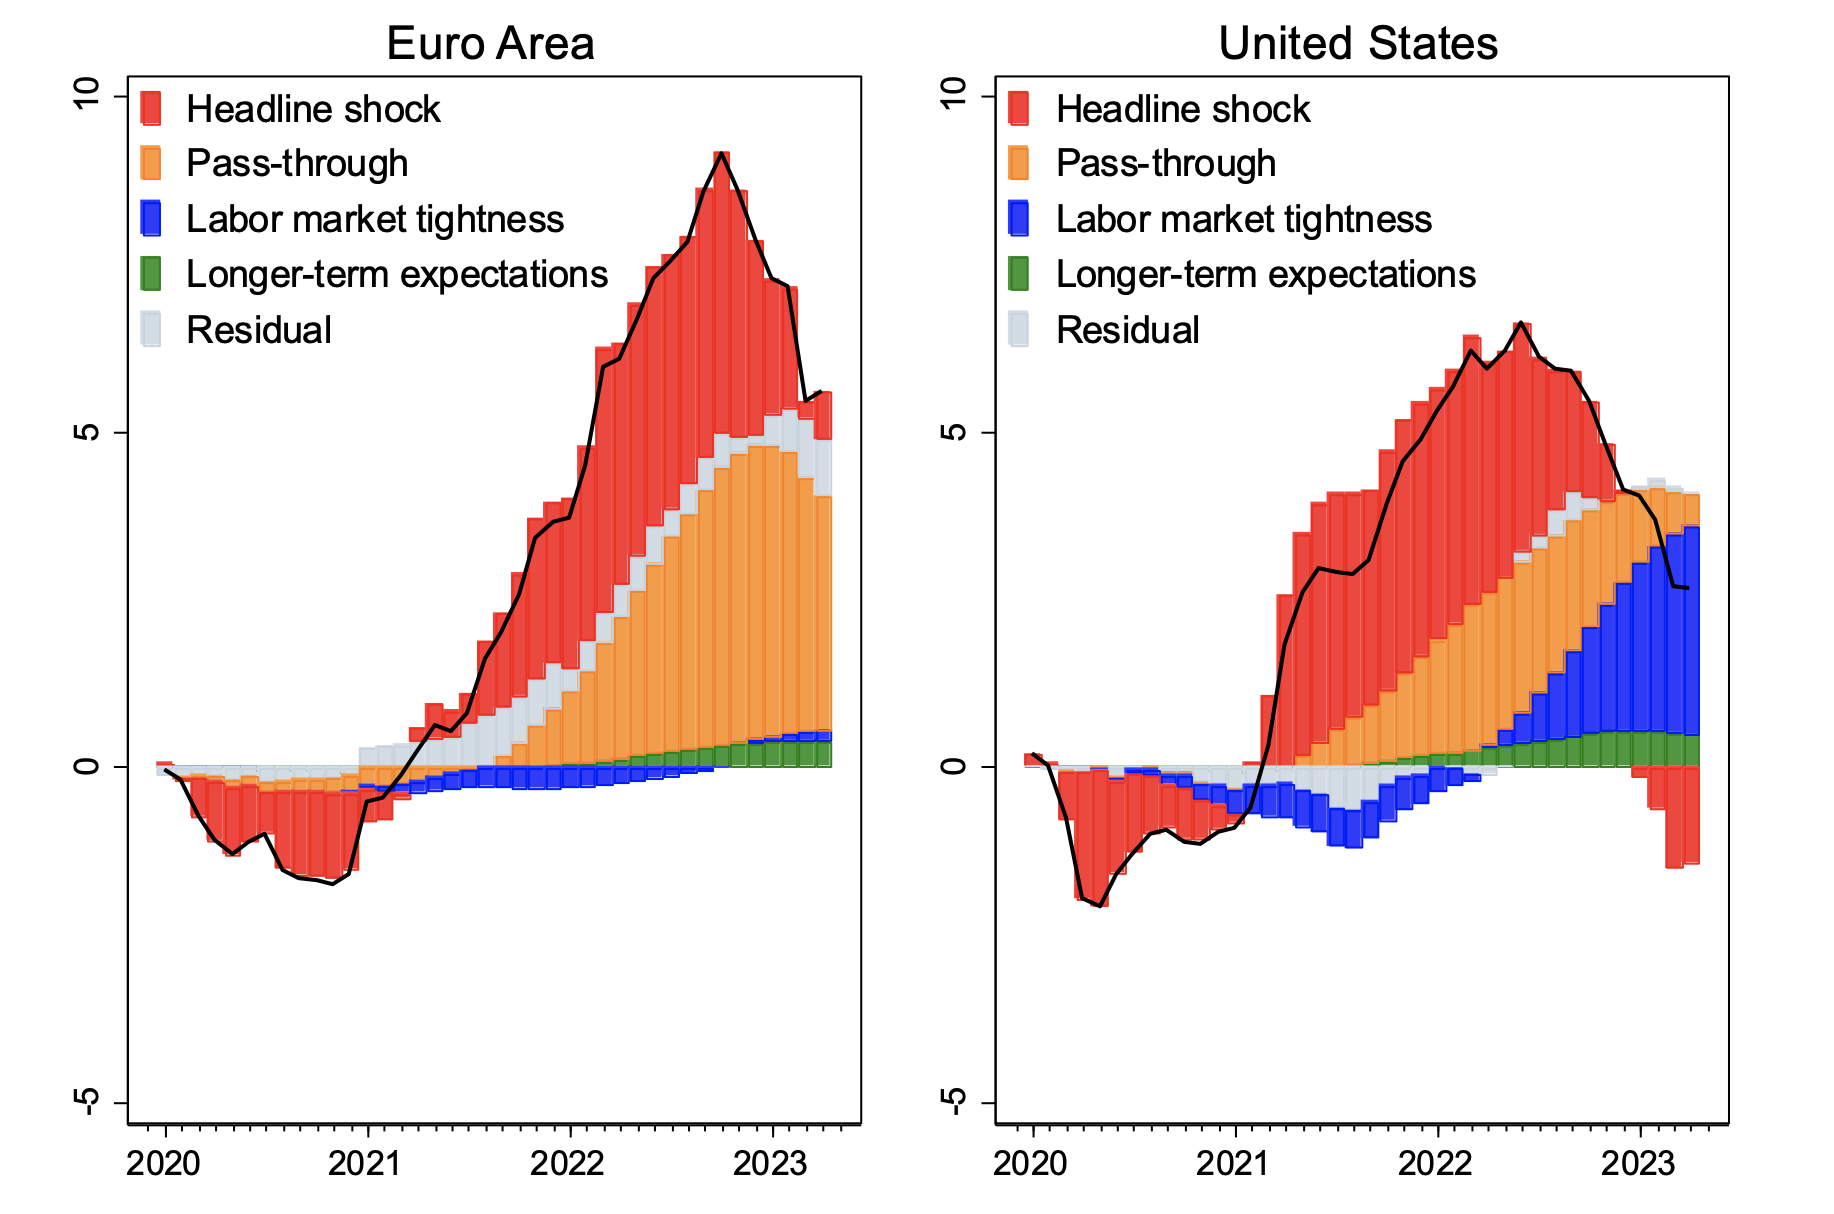
The results, reported in Figure 2, highlight the dominant role of energy price shocks in driving headline inflation in the euro area, both directly as well as through their pass-through effects on core inflation. At the peak in October 2022, headline inflation is 10.6%, which is 9.7 percentage points higher than in January 2021. Of this difference, 4.8 percentage points reflect the estimated direct contribution of energy price inflation to headline-inflation shocks, and 4.2 percentage points reflect the associated pass-through effects into core inflation, for a total of 9.0 percentage points (93% of the total rise).
With energy price inflation subsiding in late 2022 and in early 2023, the bulk of the remaining rise in inflation compared with the January 2021 level reflects the pass-through effects of past energy price shocks into core. Pallara et al. (2023) also find that past energy shocks have driven up core inflation in the euro area.
For the US, the results are strikingly different. At the peak in June 2022, headline inflation is 7.5 percentage points higher than in January 2021. Of this difference, 2.8 percentage points reflect the estimated direct contribution of energy price inflation to headline-inflation shocks, and 0.6 percentage point reflects the associated pass-through effects. Headline-inflation shocks arising from other industries, and their associated pass-through effects, together account for 2.3 percentage points. Labour market tightness accounts for 0.8 percentage point of the rise through June 2022. 2 However, with headline inflation shocks later subsiding and turning negative, their direct and pass-through contributions fade. By April 2023, the remaining difference in inflation compared with the January 2021 level fully reflects labour market tightness.
Figure 2 Accounting for the rise in inflation
Decomposition of change in 12-month headline inflation since December 2019 (in percentage points)

Note: “Pass-through” denotes the pass-through of past headline-inflation shocks (deviations of headline from core) into core inflation. “Labor market tightness” denotes contribution of change in unemployment gap for euro area, and change in ratio of vacancies to unemployed for US. “Longer-term expectations” denotes contribution of change in longer-term inflation expectations (ECB Survey of Professional Forecasters for euro area, Survey of Professional Forecasters for the US). Based on estimates in Table 1 and Annex Table 1 in Dao et al. (2023).
The impact of unconventional fiscal policies
In such an environment, is there a role for fiscal policy in further reducing inflation? The textbook answer is an unambiguous “yes!”. Tighter fiscal policy can help monetary policy compress demand and reinforce the credibility of the overall disinflation strategy.
Yet, many European countries chose a more ‘unconventional’ fiscal policy path – one that aimed at directly countering the rise in energy prices. Using a combination of transfers, energy subsidies, and tax cuts, the aim was to contain the increase in the price of energy (including electricity and gas) for households and businesses.
To investigate whether the measures reduced inflation and, if so, by how much, we use our estimated Phillips curve framework to construct the counterfactual headline inflation paths that would have occurred in the absence of the fiscal energy measures, all else equal.
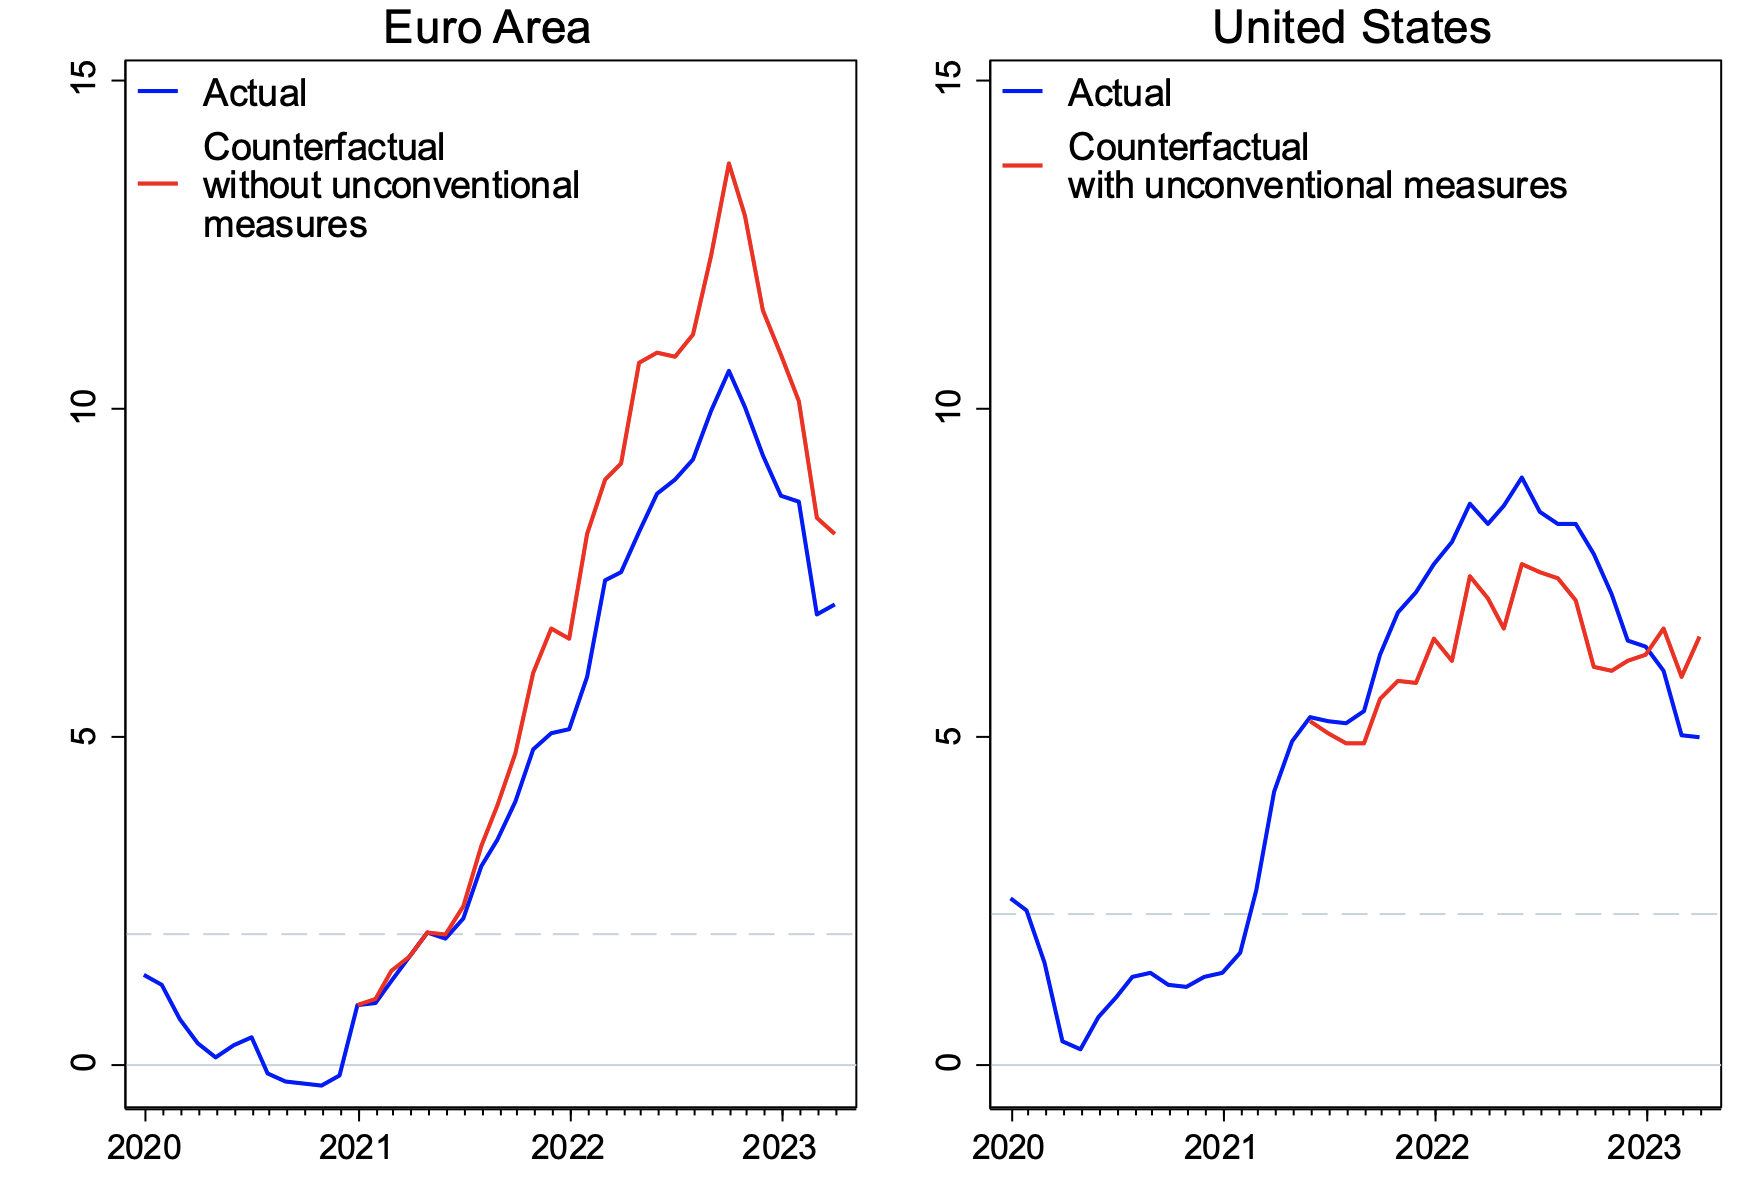
We conclude that, without the measures, euro area headline inflation would have been higher in 2022 by about 2 percentage points (Figure 3, left panel). About one-third of this difference reflects the direct impact on headline inflation. Much of the remainder reflects a lower pass-through into core inflation. Moreover, despite their fiscal cost, the measures’ effects on raising core inflation by stimulating aggregate demand have been modest, in part because the euro area has not been excessively overheated (less so than the US, for example). Our estimates also suggest that longer-term inflation expectations, as measured by the ECB’s Survey of Professional Forecasters, would have reached 2.5% by the end of 2022, 0.3 percentage points higher than the observed 2.2%, in the absence of the measures. Overall, the measures have achieved some inflation reduction. 3
Figure 3 Inflation: Actual and counterfactual, 2020-2023 (%)

Note: Horizontal dashes show 2 percent target for HICP inflation for euro area and 2.3 percent target for CPI based on 2 percent PCE target reported on Federal Reserve Bank of Atlanta Underlying Inflation Dashboard.
Does this mean that measures of this kind should be part of the standard ‘toolkit’? Here, we are more reserved. Two factors helped in the case of the euro area.
First, the energy shock turned out to be more transitory than expected. Had energy prices remained at their peak levels, avoiding the persistent inflationary effects would have required more costly – and probably unsustainable – fiscal interventions. In a counterfactual scenario where the shock to energy prices is more persistent, with energy prices staying at their peak 2022 levels and the fiscal measures being gradually unwound in 2023, headline inflation, pass-through to core, and inflation expectations are substantially higher. The upshot is that the approach is risky – the temporariness of energy price shocks in real time is difficult to ascertain.
Second, European economies were not strongly overheated to start with. The demand effects of fiscal policy on inflation are stronger when the economy is already overheated, on a steeper part of the Phillips curve. In a counterfactual exercise, we implement euro area-style measures in the US and find that headline inflation would have been lower by 1.2 percentage points on average in 2022 but would then have drifted upwards in late 2022 and exceeded the actual level by about 1.6 percentage points by April 2023 (Figure 3, right panel). Using deficit-financed, price-suppressing measures to artificially hold down core inflation in the face of a significantly overheated economy only adds to the inflation fire. At the very least, it is preferable for these measures to be fiscally neutral.
Finally, while it is beyond the scope of our analysis to fully account for the impact of price suppressing measures in one country on neighbouring countries, we note that the effectiveness of such measures depends on how segmented and inelastic energy supply is. In the case of total market segmentation and inelastic supply, measures that lower the price of energy for households and firms in one country drive up the wholesale price of energy for all countries in the same market (Auclert and others 2023). This highlights the importance of coordination for euro area countries. Further work is needed to assess the overall elasticity of supply – which is different for oil, gas, or electricity – and the ability of countries to substitute across energy sources. Designing measures with the aim of preserving price signals at the margin, for instance via non-linear or block subsidies, would allow for demand compression, avoid the risk of shortages, and minimise the fiscal exposure.
Authors’ note: The views expressed in this column are the sole responsibility of the authors and should not be attributed to the International Monetary Fund, its Executive Board, or its management.
References
Auclert, A, H Monnery, M Rognlie, and L Straub (2023), “Managing an Energy Shock: Fiscal and Monetary Policy”, NBER Working Paper 31543..
Ball, L, D Leigh, P Mishra, and A Spilimbergo (2021), “Measuring U.S. Core Inflation: The Stress Test of COVID-19”, IMF Working Paper 2021/291.
Ball, L, D Leigh, and P Mishra (2022), “Understanding U.S. Inflation during the COVID-19 Era,” Brookings Papers on Economic Activity, Fall 2022: 1-54
Blanchard, O, and B Bernanke (2023), “What Caused the US Pandemic-Era Inflation?” NBER Working Paper 31417.
Cerrato, A and G Gitti (2023), “Inflation since COVID: Supply versus demand”, VoxEU.org, 12 June.
Dao, M, A Dizioli, C Jackson, P Gourinchas, and D Leigh (2023), “Unconventional Fiscal Policy in Times of High Inflation,” IMF Working Paper 2023/178.
Pallara, K, L Rossi, M Sfregola, and F Venditti (2023), “The impact of energy shocks on core inflation in the US and the euro area”, VoxEU.org, 14 August.
Footnotes
- As Ball et al. (2021) explain, weighted median inflation isolates the core component of inflation more effectively than the traditional core measure of inflation excluding food and energy prices, especially during the COVID-19 era, when much volatility in headline inflation has come from price changes in industries other than food and energy.
- Ball et al. (2022) find that headline-inflation shocks other than energy that increased US inflation included shocks associated with backlogs of orders for goods and services, which, they argue, capture problems with supply chains, and changes in prices in auto-related industries.
- In complementary analysis, we use the IMF’s Flexible System of Global Models (FSGM) to evaluate the impact of the energy measures implemented in the euro area. The simulation results confirm that the energy measures smooth the path of inflation: reducing the overshoot in 2022-23 and preventing an undershoot in 2024.
- https://cepr.org/voxeu/columns/inflation-and-unconventional-fiscal-policy
No hay comentarios:
Publicar un comentario