La medición incorrecta de la productividad de Europa
El debate lo ha abierto Paul Krugman, quien rechaza que Europa esté en declive respecto de EEUU en renta per cápita. Luis Garicano y otros economistas han refutado sus tesis. Lo que está en juego es saber si el PIB mide bien la realidad
Krugman defiende que Europa no se ha descolgado de EEUU. Si comparas la renta per cápita en paridad de poder adquisitivo, la brecha con Alemania, Francia o Italia apenas se ha movido desde el año 2000. Suena tranquilizador. El problema es que la herramienta engaña.
Luis lo explica bien: la PPA descansa sobre deflactores que divergen con el tiempo, así que comparar bienestar con esa vara termina midiendo cosas distintas en cada país. Donde se ve la diferencia de verdad es en los salarios. En los mismos sectores, el trabajador estadounidense cobra bastante más que el europeo, y esa distancia se ensancha año tras año.
Detrás de los salarios está la productividad, y detrás de la productividad, la innovación. Ahí EEUU saca una ventaja real. Restarle importancia porque consumimos a precios parecidos lo que se inventa fuera es quedarse en la foto de hoy. La innovación marca el techo de los salarios de mañana, y ese techo en Europa lleva años sin subir.
The Mismeasurement of Europe’s Productivity
How to understand purchasing-power parity
By Philippe Aghion, Antonin Bergeaud, and Luis Garicano* (with a postscript responding to Krugman’s answer)
En una reciente serie de publicaciones en Substack, Paul Krugman hizo un argumento contraintuitivo para apoyar la opinión de que Europa no está sufriendo ningún declive de productividad en relación con Estados Unidos. Yo (Luis) respondí previamente en Silicon Continent (con Pieter). Aquí, aclaramos por qué una cadena de índices actuales de paridad de poder adquisitivo (PPA) no nos dice nada útil sobre el crecimiento de la productividad, o de hecho sobre el “crecimiento” en términos más generales. Esta es una versión de nuestra columna en Project Syndicate revisada para mayor claridad. Hay una nota técnica de uno de nosotros (Bergeaud) con los detalles minuciosos.
In a recent series of Substack posts, Paul Krugman made a counterintuitive argument to support the view that Europe is not suffering any productivity decline relative to the United States. I (Luis), previously responded on Silicon Continent (with Pieter). Here, we clarify why a chain of current purchasing power parity (PPP) indexes does not tell us anything useful about productivity growth, or indeed “growth” more broadly. This is a version of our Project Syndicate column revised for clarity. There is a technical note by one of us (Bergeaud) with the gory details.
While a PPP measures purchasing power across places at one moment, a deflator compares prices across time in one place.
PPP is useful for comparing purchasing power across countries at a point in time. But a sequence of current-PPP comparisons is not automatically a measure of real growth, because the prices used to value output change from year to year.
Mientras que un PPP mide el poder adquisitivo en distintos lugares en un momento determinado, un deflactor compara los precios a lo largo del tiempo en un lugar.
El PPP es útil para comparar el poder adquisitivo entre países en un momento dado. Pero una secuencia de comparaciones de PPP actuales no es automáticamente una medida del crecimiento real, porque los precios utilizados para valorar la producción cambian de un año a otro
Un deflactor de precios hace lo contrario: compara los precios de un país a lo largo del tiempo. Estados Unidos vendió mucho más en 2024 que en 2000, pero parte de esto se debe a la inflación. Para eliminar el impacto de la inflación, los estadísticos construyen un deflactor: un índice que muestra cómo han variado los precios internos año tras año, de modo que los precios más altos no se confundan con una mayor producción. El deflactor responde a una pregunta diferente: cuánto más produjo Estados Unidos en términos reales.
Se podrían recopilar 25 años de índices del Big Mac, pero eso solo mediría cómo cambió el precio relativo de un producto entre países. Esto es moderadamente útil para comparar economías en un momento determinado. Es inútil como medida del crecimiento de la producción total a lo largo del tiempo.
Además, el Big Mac es la excepción. La mayoría de los productos no son tan fácilmente comparables entre países. Difieren en calidad y en su grado de representatividad de lo que la gente compra. Por eso, Angus Deaton afirmó en su discurso presidencial de 2010 ante la Asociación Estadounidense de Economía que «las comparaciones de la paridad del poder adquisitivo entre países muy diferentes se basan en fundamentos teóricos y empíricos débiles».
Los dos índices de precios no tienen por qué coincidir
Ambos son índices de precios, por lo que resulta tentador suponer que se ajustan perfectamente. Sin embargo, la trayectoria de la paridad del poder adquisitivo (PPA) actual cambia el criterio de medición cada año: la producción anual se valora utilizando el sistema de precios internacional vigente. Cuando la trayectoria de la PPA y la del deflactor nacional divergen, el crecimiento de la PPA actual combina cambios en las cantidades con cambios en los precios utilizados para valorar dichas cantidades. Nada hace que ambas coincidan, incluso cuando están perfectamente construidas: no existe ningún teorema que asegure que una nueva PPA sea igual a una anterior arrastrada por la inflación relativa.
La nota técnica adjunta lo afirma formalmente: si se compara la PPA actual de Francia y Estados Unidos y se calcula la diferencia entre años, no se recupera la diferencia en su crecimiento real. Se recupera esa diferencia más un residuo de precios: la cantidad en la que la PPA entre ambos países se desvió de lo que predicen las tasas de inflación de cada país. Este residuo no proporciona información sobre cuánto más produjo cada país y es la única fuente de la discrepancia.
La discrepancia entre estas dos medidas se muestra en el gráfico a continuación, que compara dos líneas, cada una con valor cero en 1995. La línea azul representa la paridad del poder adquisitivo (PPA) real entre Francia y Estados Unidos, calculada anualmente por sus respectivas agencias estadísticas. La línea naranja muestra cuál habría sido esa paridad si se hubiera tomado la cifra de 1995 y simplemente se hubiera extrapolado utilizando el deflactor de cada país (su propia inflación). Si ambos indicadores midieran lo mismo, las líneas estarían superpuestas.
Garicano, Aghion y Bergeaud: el problema europeo de productividad no es una ilusión estadística
Since 1986, The Economist has published its “Big Mac” index, tracking the price of Big Macs in each country. Suppose a Big Mac costs $6 in the US and €5 in the eurozone. At a market exchange rate of $1.10 to the euro, the European burger costs $5.50, meaning the euro is a bit undervalued. For a Big Mac to cost the same in both places, the euro would have to strengthen to $1.20 per euro. This is the PPP: the exchange rate implied by what money actually buys.
A PPP is a form of exchange rate, built from the prices of actual goods rather than from financial markets. It is a comparison across space. The Big Mac works because the product is unusually standardized: a Big Mac in France and a Big Mac in the US are close enough that comparing their prices tells us something meaningful about relative purchasing power.
A price deflator does the opposite: it compares one country’s prices over time. The US sold far more in 2024 than it did in 2000, but some of this is due to inflation. To remove the impact of inflation, statisticians build a deflator: an index of how domestic prices have moved, year by year, so that higher prices are not mistaken for higher production. The deflator answers a different question: how much more the US produced in real terms.
You could string together 25 years of Big Mac indexes, but that would only measure how the relative price of one product changed across countries. That is moderately useful for comparing economies at a particular moment. It is useless as a measure of total output growth through time.
On top of that, the Big Mac is the exception. Most products are not so neatly comparable across countries. They differ in quality and in how representative they are of what people buy. That is why Angus Deaton famously said in his 2010 American Economic Association presidential address that “PPP comparisons between widely different countries rest on weak theoretical and empirical foundations.”
The two price indexes need not agree
Both are price indexes, so it is tempting to assume they fit together cleanly. But a current-PPP trajectory changes the yardstick every year: each year’s output is valued using that year’s international price system. When the PPP path and the national deflator path diverge, current-PPP growth mixes changes in quantities with changes in the prices used to value those quantities. Nothing causes the two to agree, even when both are built perfectly: there is no theorem that a new PPP equals an old one carried forward by relative inflation.
The companion technical note makes this statement formally: if you take the current-PPP comparison of France and the US, and difference it across years, you do not recover the difference in their real growth. You recover that difference plus a price residual: the amount by which the cross-country PPP moved away from what the two countries’ own inflation rates predict. That residual carries no information about how much more either country produced, and it is the entire source of the disagreement.
The disagreement between these two measures is shown in the chart below, which compares two lines, each set to zero in 1995. The blue line is the actual France-US PPP as their statistical agencies build it each year. The orange is what that parity would have been if you had taken the 1995 figure and simply carried it forward using each country’s own deflator—its own inflation. If the two indicators measured the same thing, the lines would be on top of each other.
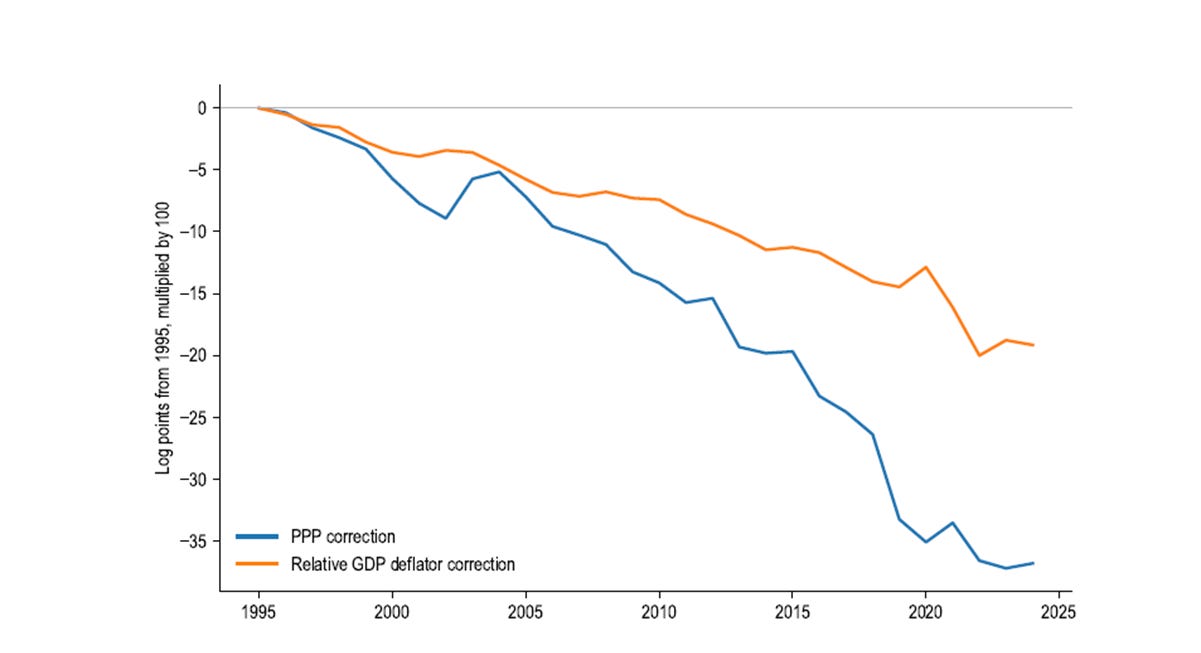
France and the US. 1995 = 0. In blue, the change in the France-US PPP. In orange, the change the two countries’ national deflators would predict. If a PPP were simply an old comparison updated for inflation, the lines would coincide. Source: OECD.
The lines track together until about 2005, then split—and keep splitting. By 2024, they are roughly 18 log points apart. That gap is large enough to neutralize nearly all the measured growth divergence between France and America. Current PPPs and national deflators are giving sharply different answers to what at first sight looks like the same price question. Indeed, a 2026 research note by Robert Inklaar finds the same divergence and shows it is economically large in recent Europe-US comparisons.1 The gap is much smaller when France is compared with several large European countries.
There are two reasons for this lack of coincidence: one is the problem of measuring technological progress; the other is the way the baskets are constructed.
The problem of technology
Krugman cites the finding by the Federal Reserve Bank of Chicago that information technology is about 8% of US private-sector output but produced about 45% of all American productivity growth since 1988. This is exactly the kind of sector where measurement is difficult. The volume produced has exploded, the price per unit has collapsed, and the quality of the products has changed enormously.
There are two ways this can create a wedge. The first is a weighting issue. If the US produces more of the goods whose prices fall rapidly, then valuing both economies at today’s prices can make part of the earlier volume gain look smaller. The following chart, from a May 2026 paper by Charles Jones and Christopher Tonetti, shows that the increase in the quantity of computers sold took place at the same time as an even larger decrease in the price of computers, leading to a drop in the share of value added of computers.
The Share of Factor Income Paid to Computers
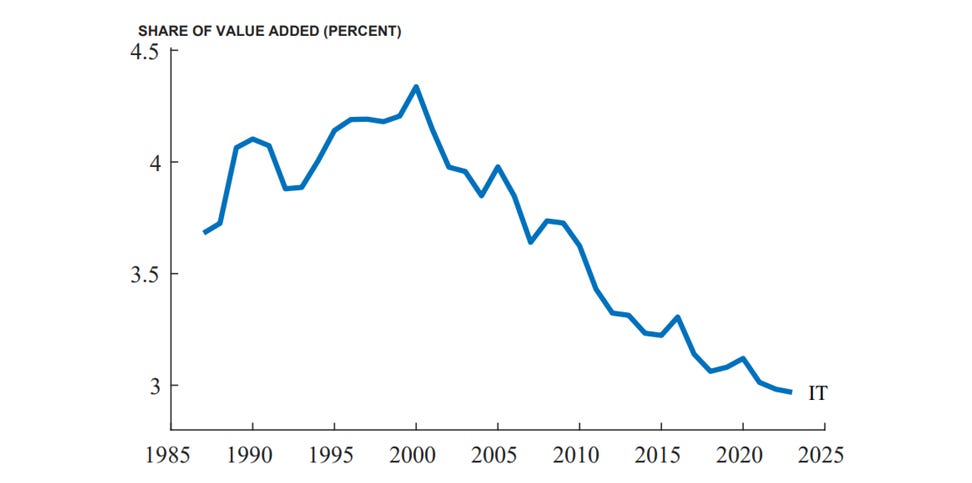
The factor-income share of information technology in the private business sector in the US. Source: Jones and Tonetti (2026) with data from the Bureau of Labor Statistics.
The second concerns quality adjustments. National deflators aim to account for quality and technological progress over time. They ask how the price of mobile-phone services and devices in France changed between 2023 and 2024, after adjusting for changes in quality. If this year’s phone is more expensive than last year’s phone, the statistician must account for how much of the increase is true inflation and how much reflects higher quality.
By comparing products at the same date, PPP tries to avoid that problem. If the same phone is sold in France and in the US in 2024, the PPP survey can compare the two prices directly. It does not have to ask whether the 2024 phone is better than the 2023 phone, but whether French and US products are sufficiently similar at that date. A sequence of current PPPs never makes this adjustment over time, and so never records the technological progress the deflator builds in year by year. Where products improve fastest, as in information technology, that gap is largest.
If a country doubles its computer output while the international price of computers decreases to half the old price, current PPP records no increase in value. The quantity gain has been offset by a change in the price yardstick.
How the sausage is made
But there is a more structural problem: There exists no basket of products that is simultaneously representative within each country, comparable across countries, and stable through time. The technology section made the point about the failure of stability over time; here we tackle the clash between a representative basket and one that is comparable across countries.
Consider mobile phones. A PPP comparison would ideally compare the price of the same phone in France and the US. That sounds simple if both countries sell the same iPhone model. But even then, the relevant product may differ in contract provisions, taxes, distribution, or regulation.
Things get even more complicated once we move from standardized products to categories shaped by local tastes. Comparing Brie cheese in Paris with cheddar in Chicago would be meaningless. But comparing only Brie in both countries would also be misleading, because Brie may be representative in France and niche in the US.
The objective of the PPP construction is to price goods that are both comparable across countries and representative within each, and those two demands conflict.
The two indexes differ because they pick the basket of products by different rules. A national price index needs items that represent what its own country buys, and that is the only test it must pass. France can track a baguette, the United States can track whatever bread Americans buy, and each follows its own goods through time. To hold comparability, the International Comparison Program does not name brands and instead writes out the features that set a price, so that two countries pricing rice price the same quality grain. It marks each item as typical or not in each country.
The program cuts GDP into roughly 155 basic headings, the smallest groupings for which it knows how much each country spends. The France-US parity in our chart is the output of one such system, the comparison that Eurostat and the OECD run jointly, which prices a shared list of about 2,500 consumer goods and services, and runs without pause rather than in benchmark years. It matches those products across countries at each date. These are different baskets that answer different questions, which is why the parity and the inflation paths do not line up. Inklaar (2026) shows that even when similarly named price categories are matched across the two methods, a large gap survives, due to the specific products sampled within each category, not to the weights placed on them.
Seven time series, one conclusion
The table below puts the issue in perspective. The first seven rows report standard real labor-productivity growth: GDP is transformed using national deflators, from national accounts and related datasets. The last row reports growth in output per hour when GDP is converted every year using current PPPs.
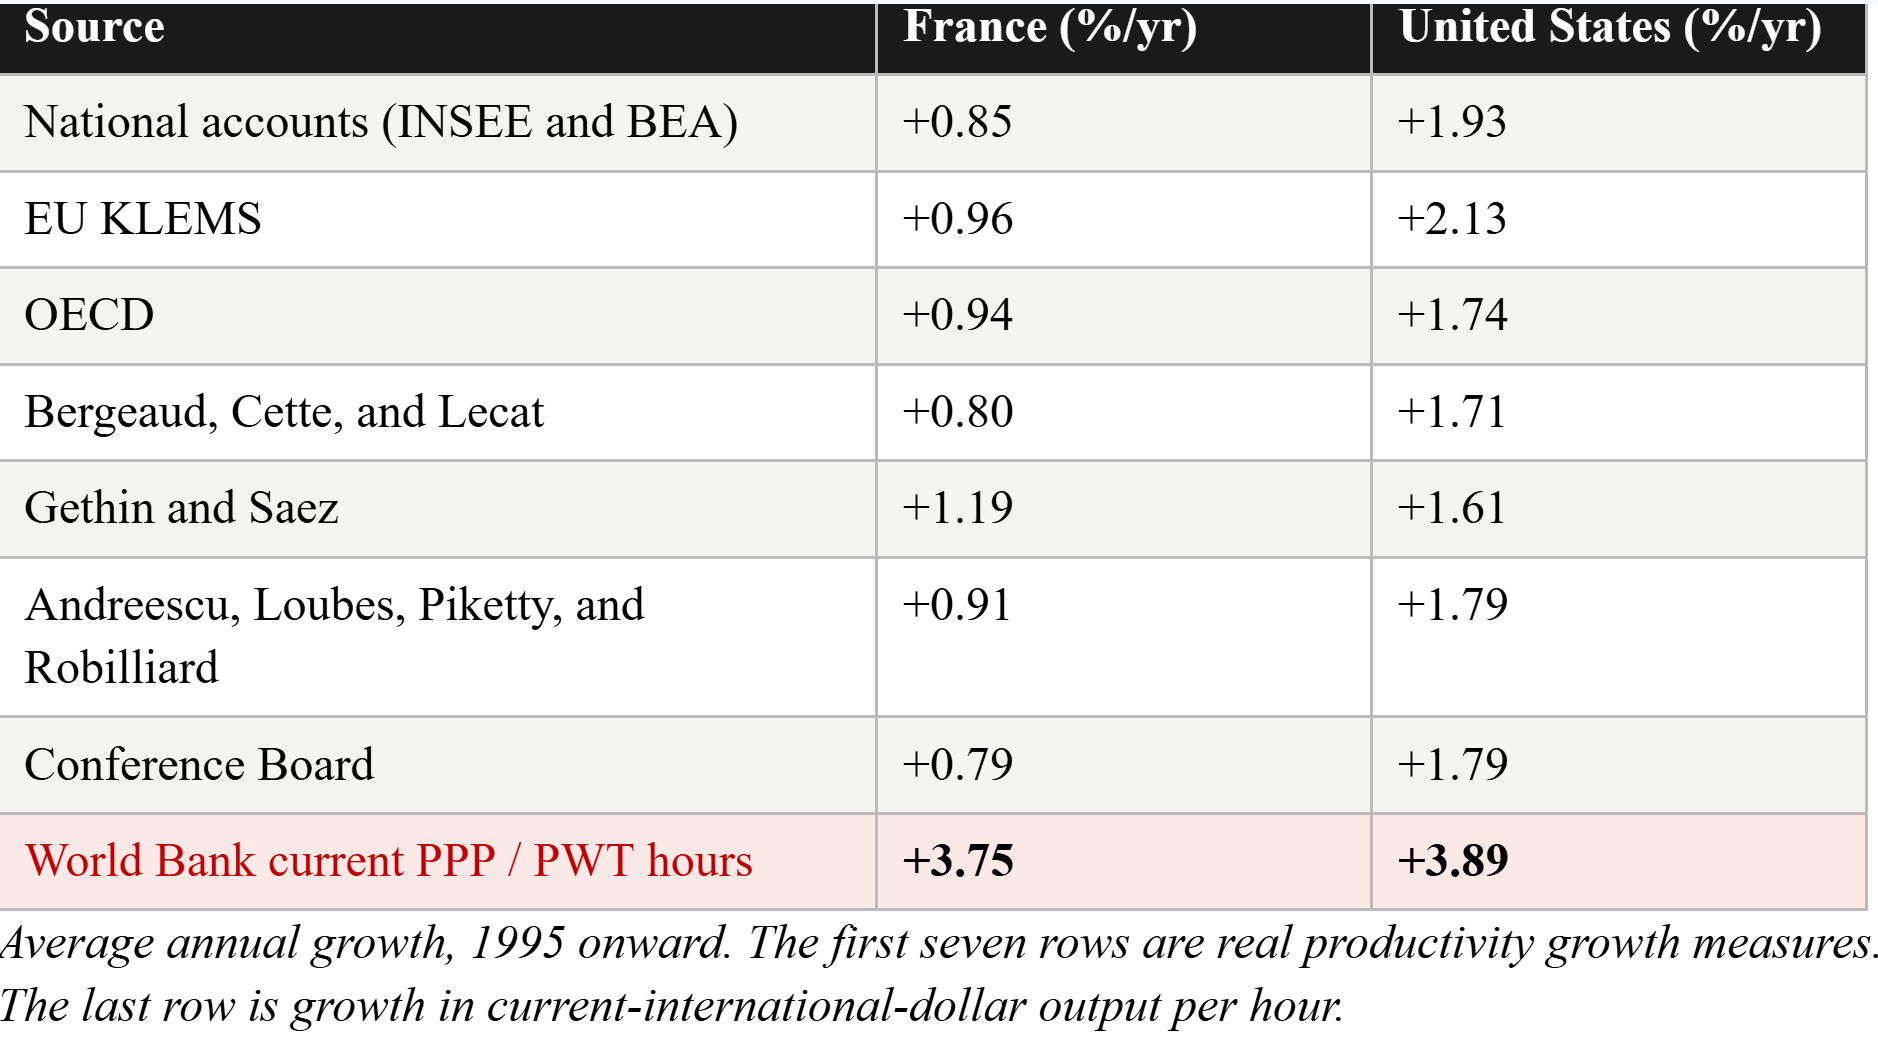
The first seven rows are the product of different teams, different datasets, and different methods, though most ultimately rely on national accounts. They agree that US productivity has grown substantially faster than French productivity for three decades.
Now read the last row. Convert GDP every year with a current PPP, as in the Krugman-style calculation, and, voilà, French output per hour grows at a similar rate to the US. The match is built by the conversion. The United States anchors the international dollar, so its PPP equals one and the yearly conversion leaves it untouched: its 3.89 is the growth in nominal output per hour, real productivity of around 1.9 percent on top of a US GDP deflator of 2 percent. France’s 3.75 carries the same two parts and one more: French real productivity, plus that same American deflator, minus the gap between the France-US PPP and the two countries’ relative inflation. Because the PPP falls faster than relative inflation can account for, that gap is negative, and subtracting a negative number lifts France’s figure by almost the whole point that its real productivity, at 0.85, trails the American 1.93. The two rates nearly meet because one US deflator inflates both and the price gap erases the real difference between them. Nothing in the last row measures how much more either country produced.
Contrary to Krugman’s argument, the US lead in technology and innovation is not helping America and Europe in the same way. It has led to higher US wages and profits, and the gap is widening each year.
So, Europe’s productivity problem is not an accounting issue. As Krugman himself once famously remarked, “productivity isn’t everything, but in the long run, it is almost everything.” Productivity growth pays for everything Europe wants to keep. It is what allows countries to raise wages, fund a welfare state, rearm, finance the green transition, and support research at the technological frontier.
We Europeans should not persuade ourselves that we do not have a real problem by confusing productivity levels with growth. We have real weaknesses, as Mario Draghi’s report on European competitiveness documented—and as all researchers and international institutions find every time they look.
In our view, these findings are not controversial. The European Union’s markets remain too fragmented. Europe’s firms stay too small. Its capital markets are insufficiently deep. And its technology, particularly digital tools, diffuses too slowly. And Europe has too few technology companies built to global scale.
These are policy choices, not fate, and they can be changed. But we in Europe will fail to change them if citizens and leaders persuade themselves that the productivity gap is an illusion because one price index makes it look smaller.
PPP is a useful instrument. It tells us what money buys in different places. But a sequence of current PPPs changes the valuation benchmark over time, and therefore cannot by itself settle a question about real productivity growth. Europe should defend what it does well. But we should be upfront about where and why we are falling behind. Otherwise, we will not cure what ails us.
Postscript in response to Krugman’s answer: Krugman has answered to the earlier version of this piece which ran in Project Syndicate, in a post dated May 30. Krugman and we agree that (1) European productivity growth has trailed the United States for three decades, and Krugman says so clearly (”I am not arguing that European productivity is mismeasured, and never said that.”) (2) Current-PPP chain and a national deflator answer different questions. (3) The weighting mechanism by which an economy that produces goods with falling relative prices sees part of its volume gain valued away, is part of the channel to explain the paradox. We disagree still on one crucial question: Krugman reads the flat current-PPP line as evidence that Europe is not falling behind, while we see it as the product of moving the price measurement stick every year. Hence we do not see the current- PPP line as indicative of anything interpretable.
We are comfortable considering that measuring growth only with national deflators is not perfect and that there is a case to support the idea that Europe falling behind may be hard to fully and precisely appreciate with one number. The precise size of the gap is open to honest argument. Two things are not. Current PPP does nothing to repair this; it trades one measurement problem for a larger one by re-pricing output every year. And for the measured decline to be an artifact rather than a fact, the error would have to be enormous: the divergence is roughly a point of annual productivity growth each year for three decades, close to eighteen log points by 2024. No quality adjustment anyone has proposed comes within reach of that.
Krugman asks us to confront the possibility that Dutch output per hour sat about 25 percent above the American level in 2000 and has fallen toward it since. He sees this as a reductio ad absurdum: surely the Netherlands was not that much more productive a generation ago. We are quite comfortable with the possibility that the Netherlands was ahead in 2000 and it has been falling behind the US year after year. This is Europe’s productivity problem, which the current-PPP comparison hides and which is the whole point of the last row of our table.
Krugman nos invita a considerar la posibilidad de que la producción por hora en los Países Bajos se situara un 25 % por encima de la estadounidense en el año 2000 y que desde entonces haya disminuido hasta alcanzarla. Considera esto una reducción al absurdo: seguramente los Países Bajos no eran mucho más productivos hace una generación. Nos resulta bastante plausible la posibilidad de que los Países Bajos estuvieran por delante en 2000 y que, año tras año, se hayan quedado rezagados con respecto a Estados Unidos. Este es el problema de productividad de Europa, que la comparación actual en términos de paridad de poder adquisitivo (PPA) oculta y que constituye el objetivo principal de la última fila de nuestra tabla.
*Philippe Aghion is a 2025 Nobel laureate in economics and a professor at the Collège de France and at INSEAD and a visiting professor at the London School of Economics. Antonin Bergeaud is Associate Professor of Economics at HEC Paris. A version of this piece was published in Project Syndicate on Friday 29th. We revised it to clarify the table interpretation and the way PPP indexes are built and also reordered some paragraphs to increase clarity. Paul Krugman has answered to this piece, but our revision was done before his answer-only the postscript incorporates them.
https://www.siliconcontinent.com/p/the-mismeasurement-of-europes-productivity
Inklaar, R. (2026, April). Comparing PPP changes with relative inflation: Evidence from PWT, Eurostat/BEA, and official PPP statistics. Draft research note
I-El auge de la política industrial de China entre 1978 y 2020. Barry Naughton II- The Trajectory of China’s Industrial Policies —IGCC Working Paper, junio de 2023
Europe Versus America: A Response to the Critics
The puzzle is real, even if you don’t like my explanation
A note for most readers: This is inside economics baseball football, a discussion mostly among professionals — and covers issues that even economists seem to be perplexed by. You have been warned.
Phillipe Aghion, Antonin Bergeaud and Luis Garicano have written a response to my discussions of the Europe/US productivity gap. I respect their standing as serious analysts, who have produced a body of valuable work.
Yet I found their article baffling, because their arguments appear to rest on the same confusion about the implications of different national productivity trends that I am trying to clarify. In fact, their apparent confusion about the point that I am making – that people often misunderstand what productivity trends mean for cross-country comparisons -- is reflected in the very title of their article, The Mismeasurement of Europe’s Productivity.
Let me be clear: I am not arguing that European productivity is mismeasured, and never said that. I am, instead, arguing that standard measures of productivity do not have the implications for cross-country comparisons of living standards and economic welfare that many people – including many economists – think they have. To put it a slightly different way: people are using data that is unsuited for the kinds of comparisons that they are trying to make. Thus, the conclusions that they are drawing from the data are misguided. But this is not to say that the data are wrong.
The apparent misunderstanding by Aghion et al of what I am trying to say is also reflected in their discussion. Their presentation mostly centers on arguing that European productivity growth is in fact lower than US productivity growth. This is puzzling, because I am not arguing that European productivity growth matches or exceeds US productivity growth. Like Aghion et al, I am fully aware that European productivity growth is lower than in the U.S. But this is not the actual issue that I am trying to address. My question is whether the standard comparison of European and US productivity growth rates is a good indicator of what is actually going on in the two economies over time.
From my viewpoint, the starting point for the debate on the relative performance of the EU and the US should be the acknowledgment that a comparison of US-Europe productivity trends looks very different if you use two different metrics.
One method is to compare the growth in inflation-adjusted GDP per hour within countries. This is a standard way to make cross-country comparisons, but one that answers the wrong question. The other method is to compare the year-by-year value of output per worker-hour, adjusted for differences in national price levels to control for exchange rate instability, but not for changing price levels over time. This measure is, I would argue, much more meaningful for comparing trends in economic welfare across countries.
You might think, and I suspect that many observers have assumed, that these two approaches tell similar stories. But they don’t.
I’ve been in the Netherlands recently, looking at Dutch data. As a high-productivity nation with much lower measured productivity growth at constant prices than the US, the Netherlands, it turns out, offer a kind of reductio ad absurdum for many US-EU comparisons. So I’ll initially focus on Dutch data to make my point, although the basic story applies to much of the EU.
Let’s look at OECD estimates of GDP per worker-hour in the US and NL, adjusting the data two ways. The first (the blue line) looks at the ratio of NL to US productivity year by year at current prices, adjusted only for purchasing power parity. By this measure, Dutch productivity is slightly higher than US productivity now, probably because of the presence of highly capital-intensive industries associated with the port of Rotterdam. NL productivity was also slightly higher in 2000, with no significant trend:
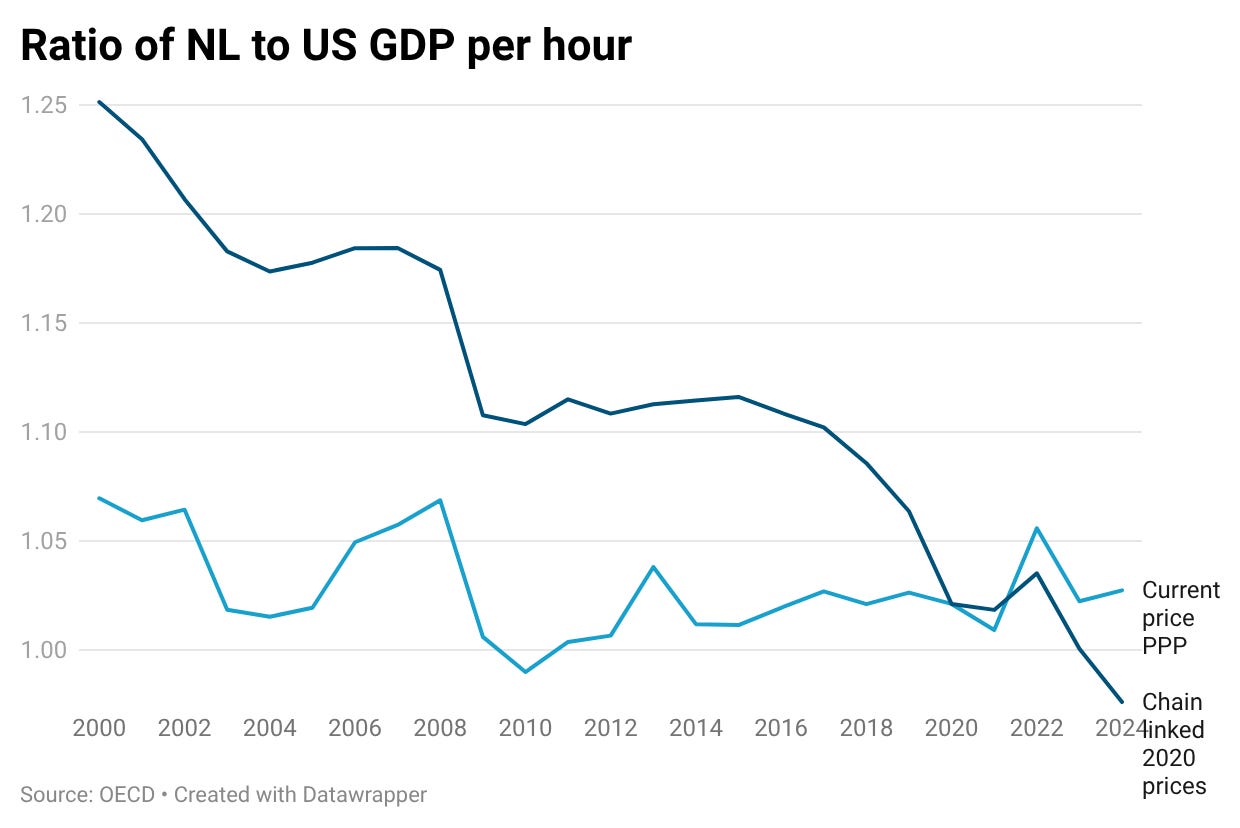
Suppose, however, that we measure GDP and hence productivity growth adjusting for national inflation rates (the black line). The OECD uses 2020 as a base year, so the two measures of relative productivity are equal in that year. But as we move back in time, they diverge. By this measure, Dutch productivity was 25 percent higher than US productivity in 2000.
Was the Netherlands drastically richer and more productive than America a generation ago? I doubt that many people would agree with that proposition. It’s certainly not what people believed at the time.
But if you find this proposition implausible, you must also concede that the conventional understanding of the implications of differing productivity growth in Europe and the US is highly problematic. If we want to compare relative economic welfare in two countries over time, surely we want to compare the value of the goods each worker can produce in any given year, tracked over time.
Think about it. Do you really want to claim that Dutch workers were much more productive than U.S. workers in the year 2000 because the goods they produced per hour, although roughly equal in value to the goods produced per hour by US workers at that time, would eventually be worth much more than US production at prices that didn’t prevail at the time — but would prevail two decades later, in 2020? Huh? Yet, when using constant-price productivity comparisons, that is exactly the claim that people are making.
Now, I have tried to explain the apparent paradox that Europe has lower productivity growth than the US but has not seen a decline in relative output per hour at current prices by pointing to the fact that the US and European economies produce different mixes of goods, with the US mix tilted toward high-tech goods with rapid productivity growth but falling relative prices. I’m open to alternative explanations of the US-EU paradox. But the paradox is there and needs explanation.
OK, as I read Aghion et al they offer four criticisms of my analysis, as follows:
First, international comparisons of GDP using purchasing power parity are problematic and unreliable: This is, of course, true. But estimates of real GDP, which are supposed to let us compare GDP within a single country in different years, are also, and I would argue equally, problematic. In a sense both comparisons of different national economies at a single point in time and comparisons of a single national economy at different points in time are imperfect metaphors resting on imperfect numbers. But I’m not aware of any reason to believe that these imperfections bias the comparisons I’ve been making in any systematic way.
Second, productivity at constant national prices has risen much faster in the US than in Europe. Why, yes. That’s not a refutation of my analysis, it’s precisely where I started — I wanted to understand how to reconcile these different rates of productivity growth with the fact that relative European productivity and purchasing power at current prices have not declined. The same data that underly the chart above show this for US and NL productivity at 2020 prices:
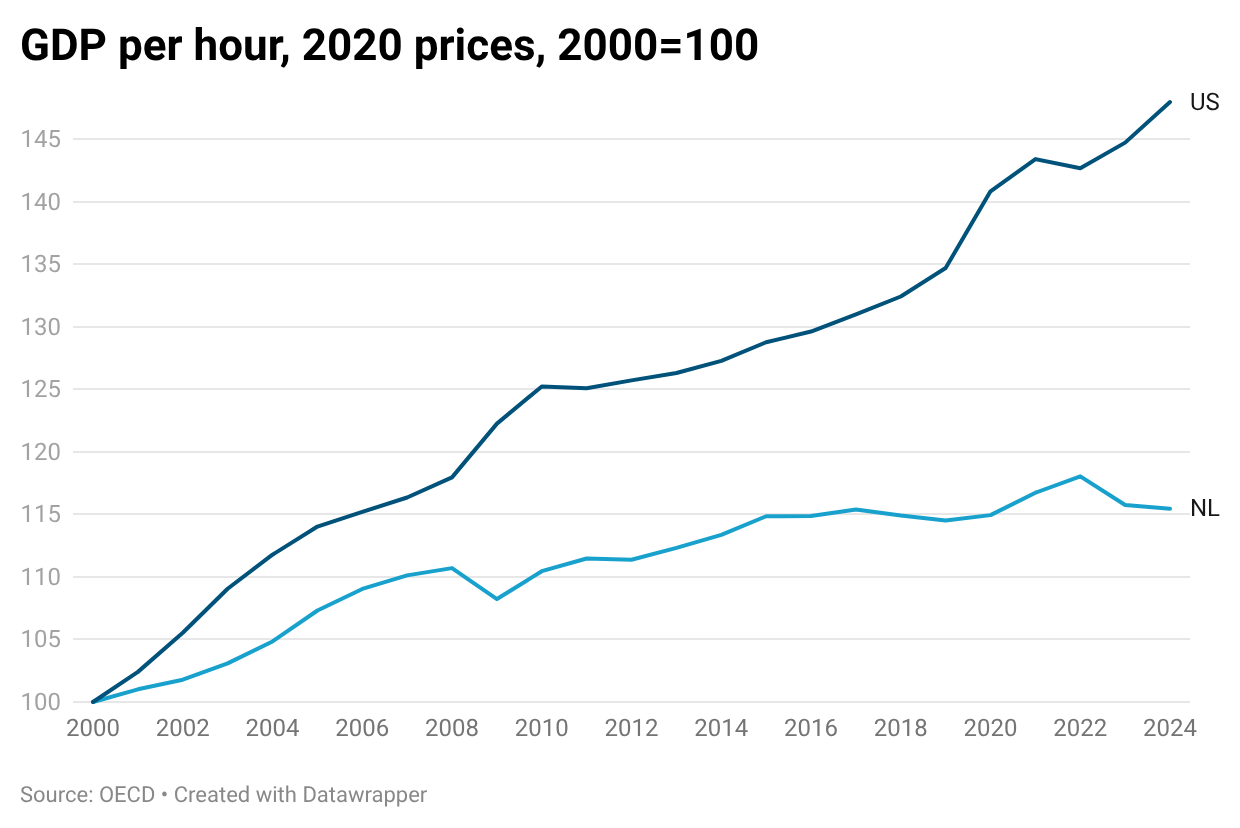
These numbers show US productivity rising 1.6 percent per year, while NL productivity rises only 0.6 percent per year. But that comparison is already incorporated in my discussion. So citing such numbers as a supposed refutation of my analysis simply misses the point. In particular, I have no idea why Aghion et al believe that a table showing multiple estimates of higher productivity growth in the US contributes to the discussion.
Third, “Current PPPs and national deflators are giving sharply different answers to what at first sight looks like the same price question, but as we saw, is not.” Indeed. That’s exactly the point I’ve been trying to make. The important point is to ask which is the right question — and if we’re asking whether Europe is falling behind in purchasing power and living standards, PPPs, which say that it isn’t, are the right measure.
A related point: Aghion et al assert as a problem with current-price comparisons that “If the US produces more of the goods whose prices fall rapidly, then valuing both economies at today’s prices can make part of the earlier volume gain look smaller.” Color me confused. That’s not a problem with these comparisons — it is precisely the mechanism I invoke to explain the apparent US-EU growth paradox. See the formal model I laid out!
Finally, Aghion et al assert that the U.S. lead in technology “has led to higher US wages and profits, and the gap is widening each year.” OK, that’s the crux of the discussion. But this assertion — which they don’t back with any data — is simply untrue. And I began this whole discussion with the observation that it isn’t true. The sum of profits and wages is factor income, which is by definition equal to GDP. Let me switch from the Netherlands to the euro area as a whole, which has somewhat lower GDP per capita than the US adjusted for differences in the price level. But this gap has not widened over time:
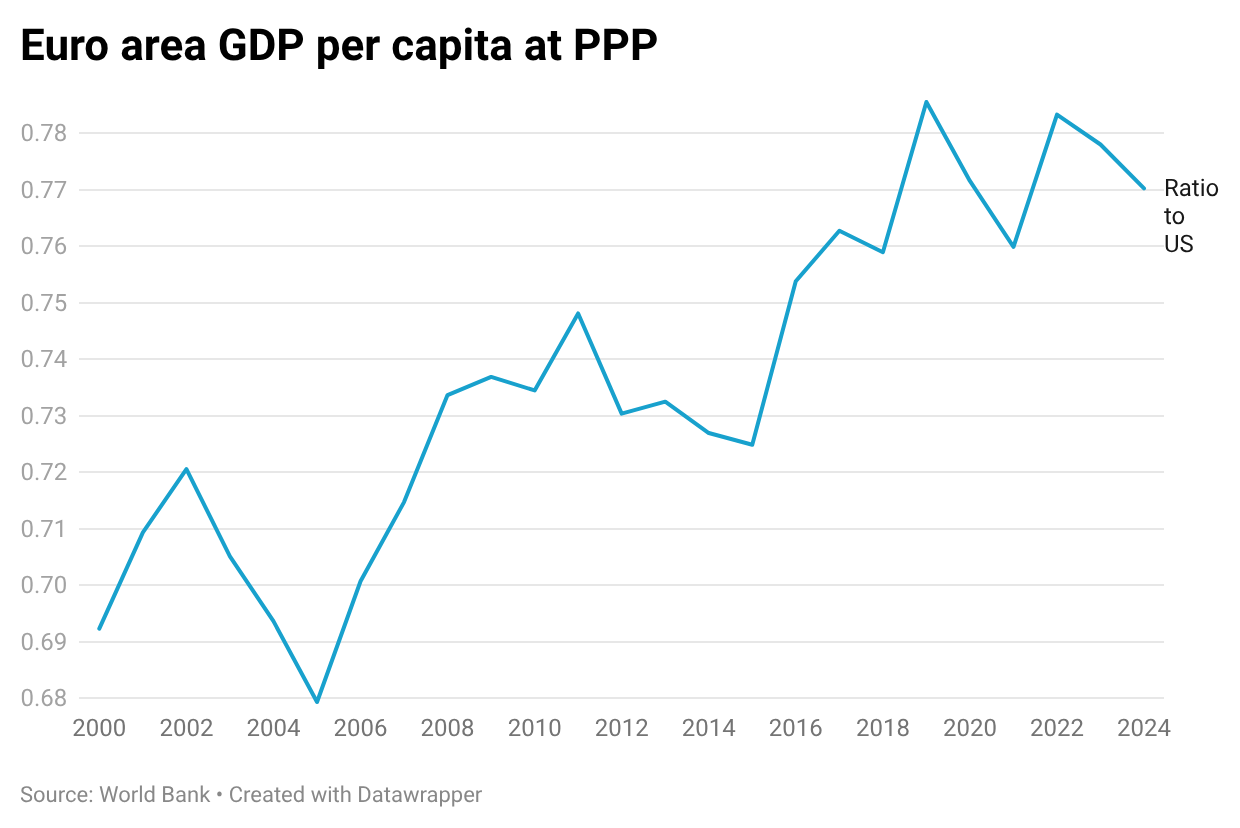
Or, if you want an independent data source, look at mean household income as estimated by LIS, the cross-national data center in Luxembourg. Between 2000 and 2021, these data show nominal income rising 3.1 percent annually in the Netherlands, 3.3 percent in the U.S. Given slightly lower inflation in Europe, this does not show a widening gap. My guess is that people simply assume that the gap must have widened because they know about the standard productivity growth comparisons. But my whole point is that these comparisons don’t mean what people think they mean.
The bottom line here is that while I could of course be wrong about the US-EU comparison, the Aghion et al critique doesn’t make the case that I’m wrong. The data that they claim refute my argument are basically the same data I used to make that argument and are completely consistent with what I’ve been saying. They are, in fact, exactly what my attempts to model the paradox predict we’d see.
Again, I’m quite willing to be proved wrong. But if we’re going to have a serious discussion, the critiques have to go beyond simply restating productivity data that show Europe lagging. They need to acknowledge the reality that despite these data, comparisons between the US and Europe at each point in time don’t show the gap between Europe and the United States widening, and at least try to explain why
https://paulkrugman.substack.com/p/europe-versus-america-a-response

No hay comentarios:
Publicar un comentario